Figure 3.
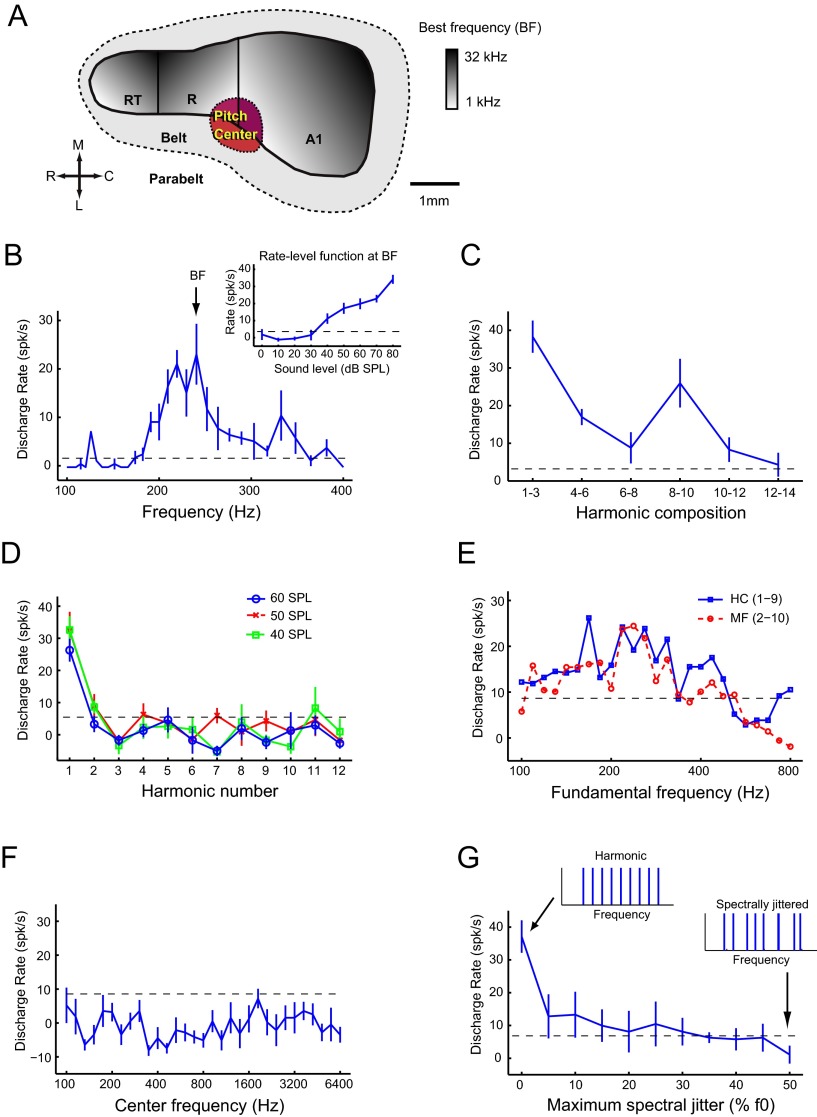
Criteria for pitch-selective neurons. A, Schematic diagram of marmoset auditory cortex with the location of the pitch-selective region indicated in low-frequency auditory cortex (red). A1, Primary auditory cortex; R (on diagram), rostral field; RT, rostrotemporal field; C, caudal; L, lateral; M, medial; R (in direction scale), rostral. B–G, Responses from pitch-selective neuron M2P-U201.1. The dashed line indicates a significant firing rate (2 SDs above mean spontaneous rate). Mean spontaneous rate is subtracted from all displayed discharge rates. B, Frequency tuning to pure tones (40 dB SPL). The BF of 240 Hz is indicated on the plot. Inset plot displays the rate-level function for a pure tone at the BF. C, Response to harmonic complex tones (f0 = BF, 3 harmonics, cosine phase, individual components at 40 dB SPL) varying in their harmonic composition. All stimuli are MF sounds except the complex tone composed of harmonics 1–3. D, Response to harmonics 1–12 of an f0 = BF, at 40, 50, and 60 dB SPL. Harmonic 1 is equal to the f0. E, Fundamental frequency tuning for two harmonic complex (HC) tones [harmonics 1–9 (blue solid) and 2–10 (red dashed), individual components at 30 dB SPL]. F, Spectral tuning to the center frequency of half-octave bandpassed noise stimulus at 50 dB SPL. G, Sensitivity to spectral jitter of the harmonics of a complex tone. Harmonic complex tones have 0% jitter (left inset). Spectral jitter was added by shifting each harmonic by a random amount ranging between 0 and the maximum spectral jitter, proportional to the fundamental frequency (right inset at 50% jitter). The original harmonic complex tone had an f0 = BF, contained harmonics 4–12, with each component at 30 dB SPL.

