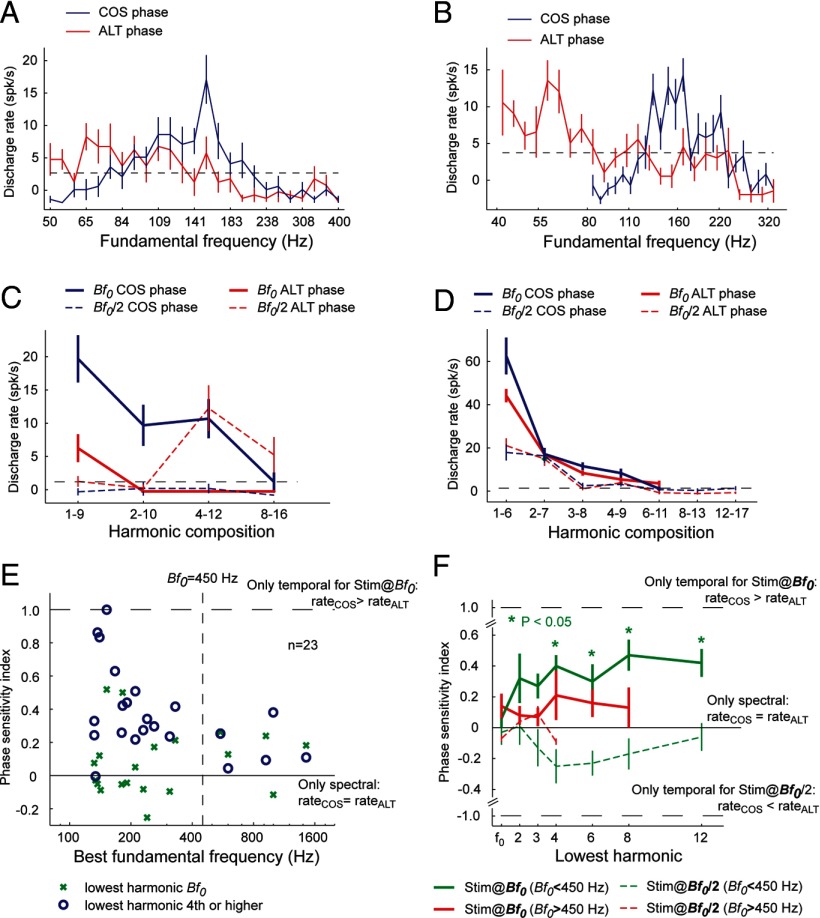
Figure 4.
Phase sensitivity experiment in pitch-selective neurons. A, B, Tuning curves of two pitch-selective neurons in response to harmonic complex tones varying in fundamental frequency. COS (blue) and ALT (red) complex tones were used. For these two neurons, the Bf0 for ALT stimulus is ∼1 octave below that of COS stimulus. C, An example of a pitch-selective neuron (unit M36N-534.1) that is sensitive to changes in the phase of harmonics in a complex tone. The Bf0 of this neuron is 152 Hz. Four types of stimuli were tested in four harmonic compositions (1–9, 2–10, 4–12, and 8–16): COS stimulus at Bf0 (solid blue curve), COS stimulus at Bf0/2 (dashed blue curve), ALT stimulus at Bf0 (solid red curve), and ALT stimulus at Bf0/2 (dashed red curve). The dashed line indicates the minimum firing rate criterion for a significant response (2 SDs above the mean spontaneous rate). D, An example of a pitch-selective neuron (unit M32Q-44.1) that is less sensitive to changes in the phase of harmonics in a complex tone. The Bf0 of this neuron is 1.45 kHz. Four types of stimuli were tested in seven harmonic compositions. Format is the same as in A. E, The PSI is plotted against Bf0 for a population of pitch-selective neurons. The PSI was calculated for complex tones with low-order harmonics (containing the fundamental) and for complex tones with higher-order harmonics (harmonic 4 or higher). Vertical dashed line indicates fundamental frequency of 450 Hz. The two horizontal lines indicate a PSI of 0 and 1, respectively. F, Mean PSI as a function of the lowest harmonic for pitch-selective neurons. Only for Bf0 < 450 Hz were PSIs significantly different from 0 for harmonic compositions, with the lowest harmonics being the 4, 6, 8, or 12 (signed-rank test, p < 0.05, Bonferroni's corrected) when tested at a the Bf0 of a neuron (solid green curve). The dashed horizontal lines indicate a PSI of 1 and −1, respectively.

