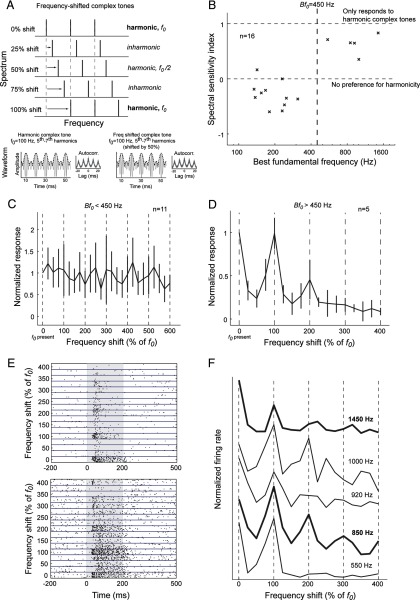
Figure 5.
Experiment with frequency-shifted complex tones. A, Each harmonic of a three-component complex tone was shifted in frequency by an amount relative to the fundamental frequency. Thus, a 25% frequency shift in a complex tone (with f0 = 100 Hz) would be a 25 Hz increase in frequency for each harmonic, resulting in an inharmonic complex tone. Frequency shifts of multiples of 100% of f0 resulted in harmonic complex tones (components were integer multiples of the fundamental frequency). Harmonic complex tones (f0 = 100 Hz, harmonics 5–7, left bottom plot) and odd-harmonic complex tones (f0 = 100 Hz, harmonics 5–7 shifted by 50%, right bottom plot) differed slightly in their waveforms but had similar envelope periodicity (dashed line). The autocorrelations of the half-wave-rectified waveforms of these complex tones were also similar (see insets of each plot). B, Spectral sensitivity of pitch-selective neurons. Vertical dashed line indicates Bf0 = 450 Hz. The horizontal dashed lines indicate a spectral sensitivity index of 1 and 0, respectively. C, The mean normalized response of pitch-selective neurons with Bf0 < 450 Hz to frequency-shifted complex tones. Vertical dashed lines indicate shifts of multiples of 100% of f0 (i.e., harmonic complex tones). Normalized responses were calculated by dividing the discharge rate by the maximum response of the neuron to the stimulus set. D, Normalized response pitch-selective neurons with Bf0 > 450 Hz to frequency-shifted complex tones. Vertical dashed lines indicate shifts of multiples of 100% of f0 (i.e., harmonic complex tones with a fundamental frequency equal to the Bf0 of the neuron). E, Raster plots of two pitch-selective neurons with Bf0 > 450 Hz responding to frequency-shifted complex tones. Top, Unit M32Q-44.1, Bf0 = 1450 Hz. Bottom, Unit M2P-113.1, Bf0 = 850 Hz. F, Responses of five pitch-selective neurons (Bf0 > 450 Hz) to harmonic and inharmonic complex tones (from top to bottom: unit M32Q-44.1, unit M32Q-35.1, unit M41O-276.1, unit M2P-113.1, and unit M32Q-109.1). Vertical dashed lines indicate harmonic complex tones (100% shifts). The Bf0 of each neuron is indicated next to each curve. The neurons are ordered from bottom to top by increasing Bf0. The bold curves indicate the two example neurons shown in E.

