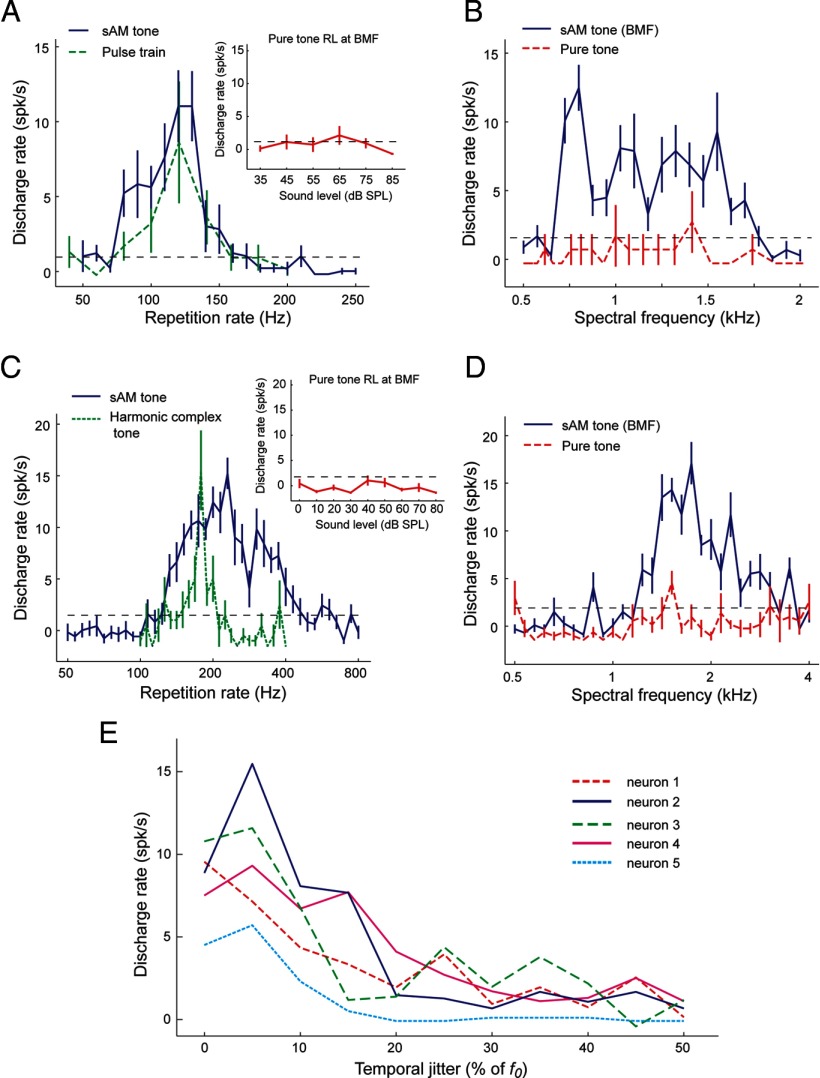
Figure 6.
A, B, An example neuron (unit M2P-226.1) in the putative pitch center +tuned to the envelope modulation frequency (but not spectral frequency). A, Similar tuning for sAM tones varying in modulation frequency (blue solid line) and pulse trains varying in envelope repetition rate (green dashed line). Both stimuli were played at 70 dB SPL. The rate-level (RL) function of the unit measured by pure tones at the best modulation frequency (BMF) of the neuron is shown in the inset. No significant response was observed at any sound level tested. B, This neuron responded to sAM tones at its best modulation frequency over a wide range of carrier frequencies (blue solid line) but did not respond to pure tones over the same spectral range (red dashed line). The horizontal black dashed line indicates the minimum firing rate criterion for a significant response (2 SDs above the mean spontaneous rate). C, D, An example neuron (unit M410–309.1) that responded to MF harmonic complex sounds but did not respond to pure tones at its best modulation frequency and had weak or no responses to pure tones at higher frequencies. C, Similar tuning for sAM tones varying in modulation frequency (blue solid line) and harmonic complex tones varying in fundamental frequency (green dashed line). The neuron did not respond to pure tones at its best modulation frequency across sound level (inset). D, This neuron responded to sAM tones at its best modulation frequency over a wide range of carrier frequencies (blue solid line) but did not respond to pure tones over the same spectral range (red dashed line). E, Responses to regular and irregular acoustic pulse trains by five modulation sensitive neurons in the putative pitch center. All five neurons showed decreased responses to temporally irregular pulse trains.

