
Figure 3.
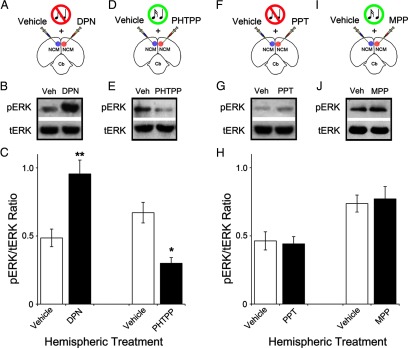
Activation of ERβ, but not ERα, is both necessary and sufficient to drive the MAPK pathway in NCM. A, Camera lucida drawing of a coronal section schematic depicting the experimental setup for injections in the awake zebra finch. In this group, sound-isolated animals were unilaterally infused with vehicle and contralaterally injected with the selective ERβ agonist DPN (n = 5; see Materials and Methods for details). B, Western-blots depicting the levels of pERK and tERK in NCM samples treated with the manipulations shown in A. Note that activation of ERβ with DPN drives the phosphorylation of ERK in sound-isolated animals. C, Quantification of the results shown in B and E. Depicted is the mean (±SE) signal ratio for pERK and tERK obtained for each experimental treatment, along with their respective control (vehicle) levels. D, Schematic representation of a coronal section depicting the experimental manipulation carried out in song-stimulated animals. The ERβ antagonist PHTTP was unilaterally infused (vehicle was injected contralaterally; n = 4); next, animals were stimulated for 5 min with conspecific songs. E, Representative Western-blots depicting pERK and tERK levels in NCMs subjected to each of the hemispheric manipulations shown in D. Note that blockade of ERβ largely suppresses the song-induced phosphorylation of ERK. F, Coronal section schematic illustrating the manipulation conducted in song-isolated animals. The ERα agonist PPT was infused in one hemisphere and vehicle was injected contralaterally (n = 5). NCM samples were then obtained for each hemisphere separately. G, Western-blots depicting representative pERK and tERK levels in NCM as a result of the treatments shown in F. Note that activation of ERα with PPT does not affect basal pERK levels in sound-isolated animals. H, Quantification of the results shown in G and J. Shown is the mean pERK/tERK ratio (±SE) obtained for each experimental treatment, along with their respective control (vehicle) levels. I, Coronal section schematic illustrating the experimental protocol used in song-stimulated animals. Whereas the ERα antagonist MPP was infused in one hemisphere, vehicle was injected contralaterally (n = 4). Animals were subsequently stimulated for 5 min. J, Western-blots revealing pERK and tERK levels in NCMs subjected to the hemispheric manipulations shown in I. Note that blockade of ERα does not affect the song-induced phosphorylation of ERK, as quantitatively assessed in H. Western blot data shown for each group (vehicle vs drug) reflects representative cross-hemispheric comparisons obtained from single animals (internal controls). *p < 0.05; **p < 0.01.