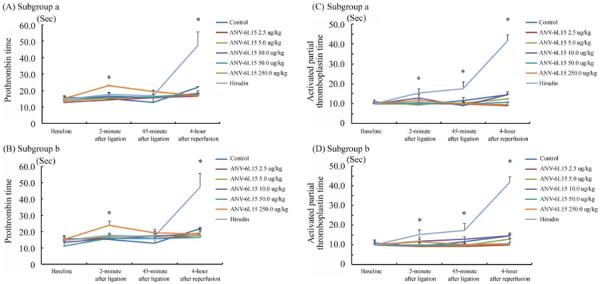
Figure 3.

Prothrombin time (PT) and activated partial thromboplastin time (aPTT) over the time course of I-R. Blood samples were taken at the indicated time points. (A) PT after ANV-6L15 injection at 1 minute before coronary ligation; (B) PT after ANV-6L15 injection at 2 minute after coronary ligation; (C) aPTT after ANV-6L15 injection at 1 minute before coronary ligation; and (D) aPTT after ANV-6L15 injection at 2 minute after coronary ligation. Data represented mean ± SD. Asterisks indicate a statistically significant difference (P < 0.05) compared to baseline.
