Fig. 3.
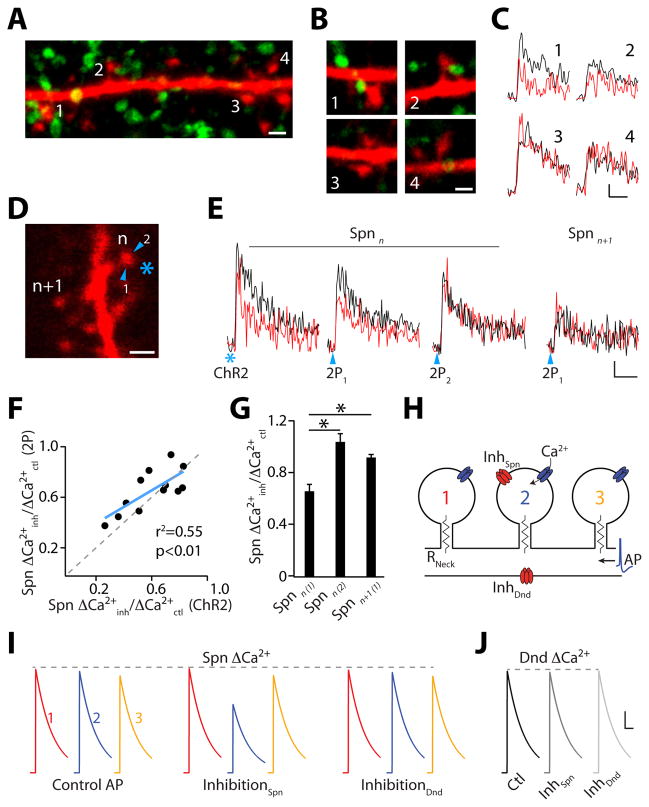
GABAergic synapses on spines mediate local Ca(2+) inhibition. (A) Confocal projection of a dendrite (red) and ChR2-EYFP-positive boutons (green). Scale bar: 1 μm. (B) Single section images of spines from (A). Scale bar: 1 μm. (C) ΔCa(2+) measured in spines from (B) for AP (black) and IPSP-AP (red). Scale bars: 1% ΔG/Gsat, 50 ms. (D) Inhibition mapping utilizing ChR2 (asterisk) or 2PLUGABA (arrowheads). Scale bar: 1 μm. (E) ΔCa(2+) in reference spine (n) and neighbor (n+1) for AP (black) and IPSP-AP (red). Scale bars: 2% ΔG/Gsat, 50 ms. (F) Correlation between ChR2- and 2PLUGABA-evoked inhibition. (G) Average Ca(2+) inhibition (±SEM) evoked by 2PLUGABA. (H) Computational model of dendritic inhibition. (I) Simulated GABAergic input selectively inhibits ΔCa(2+) in spine 2. GABAergic input onto dendritic shaft has minimal effect on ΔCa(2+). (J) GABAergic input does not inhibit Ca(2+) in the dendritic shaft. Scale bars (I and J): 100 nM, 100 ms. * indicates p<0.05 (paired Student’s t-test).

