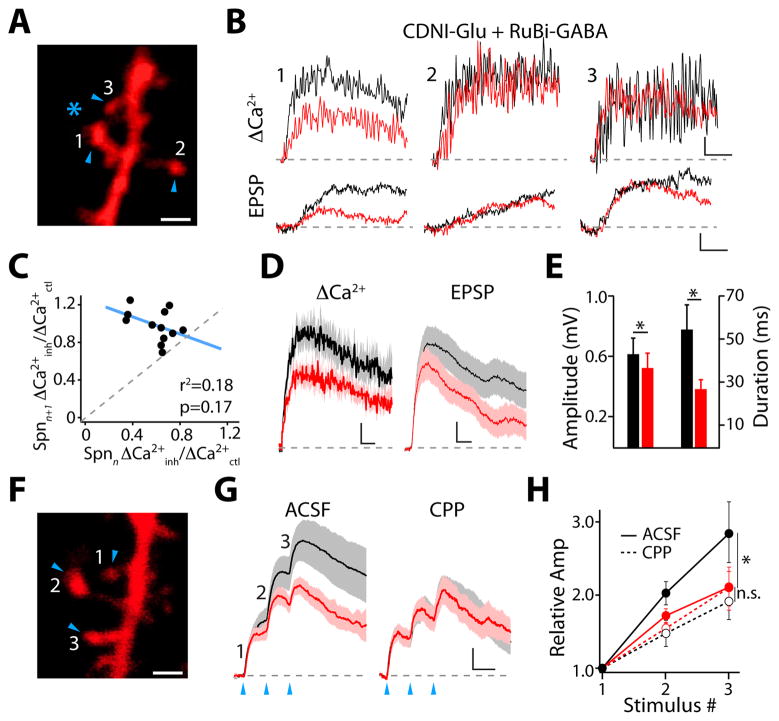
Fig. 4.
Dendritic inhibition regulates synaptic integration. (A) Inhibition of responses evoked by 2PLUGlu (arrowheads) utilizing 1-photon GABA uncaging (asterisk). Scale bar: 1 μm. (B) ΔCa(2+) and voltage transients for EPSP (black) and IPSP-EPSP (red) for spines indicated in (A). Scale bars: 4% ΔG/Gsat, 50 ms (upper), 0.1 mV, 5 ms (lower). (C) Ca(2+) inhibition is not correlated between neighboring spines. (D) Average ΔCa(2+) and somatic voltage transients (± SEM) for EPSP alone (black) and IPSP-EPSP (red) pairing. Scale bars: 2% ΔG/Gsat, 50 ms (left), 0.1 mV, 10 ms (right). (E) Average amplitude and duration (±SEM) of voltage transients for EPSP (black) and IPSP-EPSP pairing (red). (F) Integration of responses evoked by 2PLUGlu (arrowheads). Scale bar: 1 μm. (G) Average voltage transients (± SEM) for EPSP (black) and IPSP-EPSP (red) evoked by 2PLUGlu on three neighboring spines, recorded in control ACSF (left) or with NMDARs blocked by CPP (right). Scale bars: 0.25 mV, 20 ms. (H) Relative summation of EPSPs (black) or IPSP-EPSPs (red), recorded in control ACSF or with CPP. * indicates p<0.05 (Wilcoxon matched pairs test).

