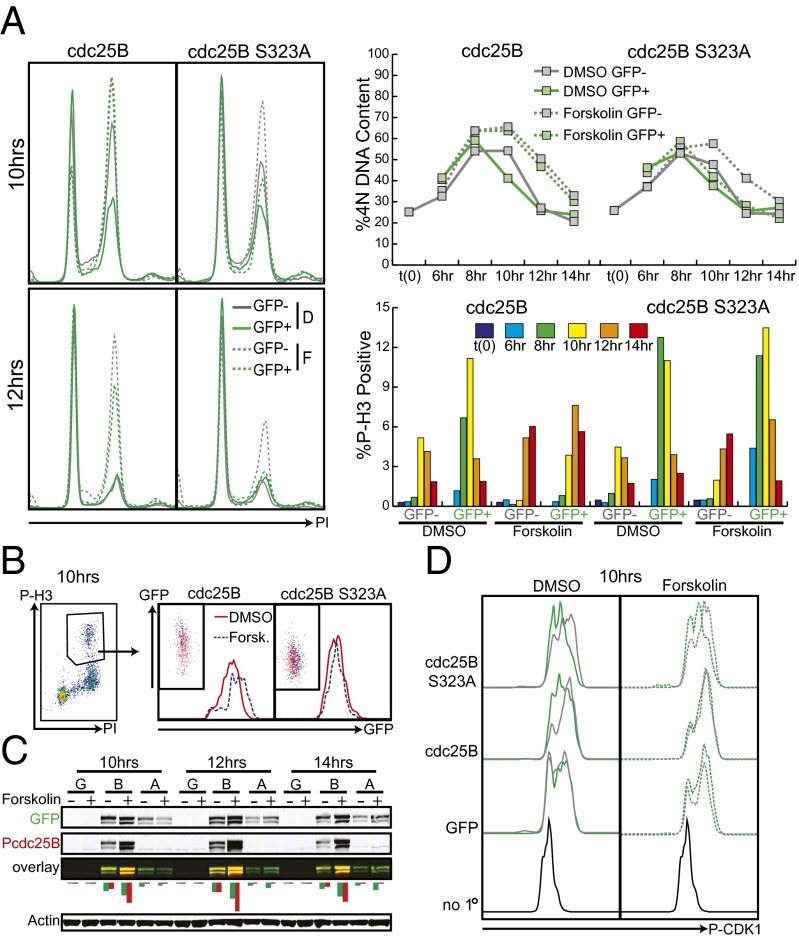
Fig. 5.
Forskolin-induced cell cycle delay is rescued by expression of active cdc25B. (A) MM370 pLVX tet on/pLVX tight puro GFP-cdc25B or GFP-cdc25B 323A cells were synchronized, released into doxycycline and treated with DMSO or forskolin 5 h postrelease. Cells were fixed at indicated time points and stained for DNA content and P-H3. The percentages of 4N cells and P-H3+ cells are quantified in Right. (B) GFP levels were assessed in the P-H3–positive population of cells from A. In the cdc25B wild type, but not S323A mutant, there was a nearly twofold increase in median fluorescence intensity in the forskolin treated wells compared with the DMSO-treated wells. There was no change in median fluorescence intensity in GFP-positive cells that were ungated for P-H3 (Fig. S1). (C) Duplicate wells from the above experiment were lysed and protein was visualized by immunoblot. Fluorescence intensities of the green (GFP/total cdc25B) and red (P-cdc25B S323) bands were quantified and graphed below the overlay blot. Transfection conditions are identified as: G = GFP, B = cdc25B, A = cdc25B S323A. (D) Duplicate wells from the above experiment were fixed in formaldehyde, methanol-permeabilized, stained for P-CDK1 (Y15), and analyzed by flow cytometry.

