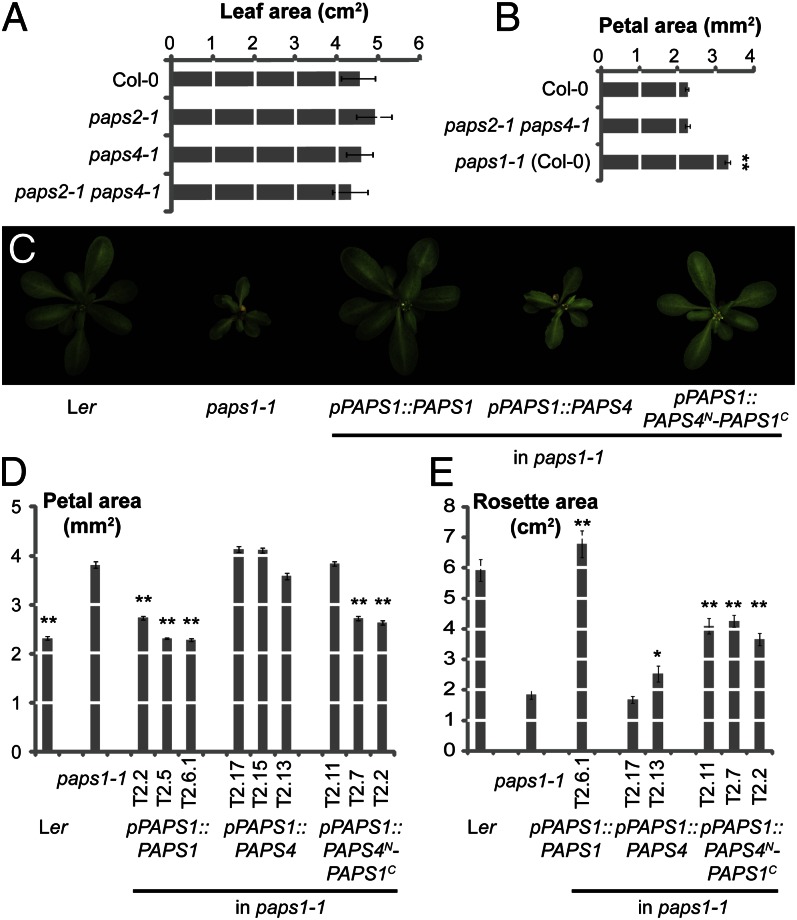
Fig. 2.
The three nuclear PAPS isoforms in A. thaliana fulfill distinct functions. (A and B) Quantification of leaf (A) and petal size (B) in the indicated genotypes. Values are mean ± SE from at least five leaves and 20 petals per genotype. **Significantly different from wild-type value at P < 0.01 (t test). (C) Top views of plants of the indicated genotypes. (D and E) Quantification of petal (D) and rosette (E) size in the indicated genotypes. Individual bars represent independent transformant lines for the transgenic plants. Values are mean ± SE from at least 15 petals and at least six rosettes per genotype. Asterisks (*,**) indicate significant difference from paps1-1 mutant value at P < 0.05 (*) or P < 0.01 (**) according to t test with Bonferroni correction.

