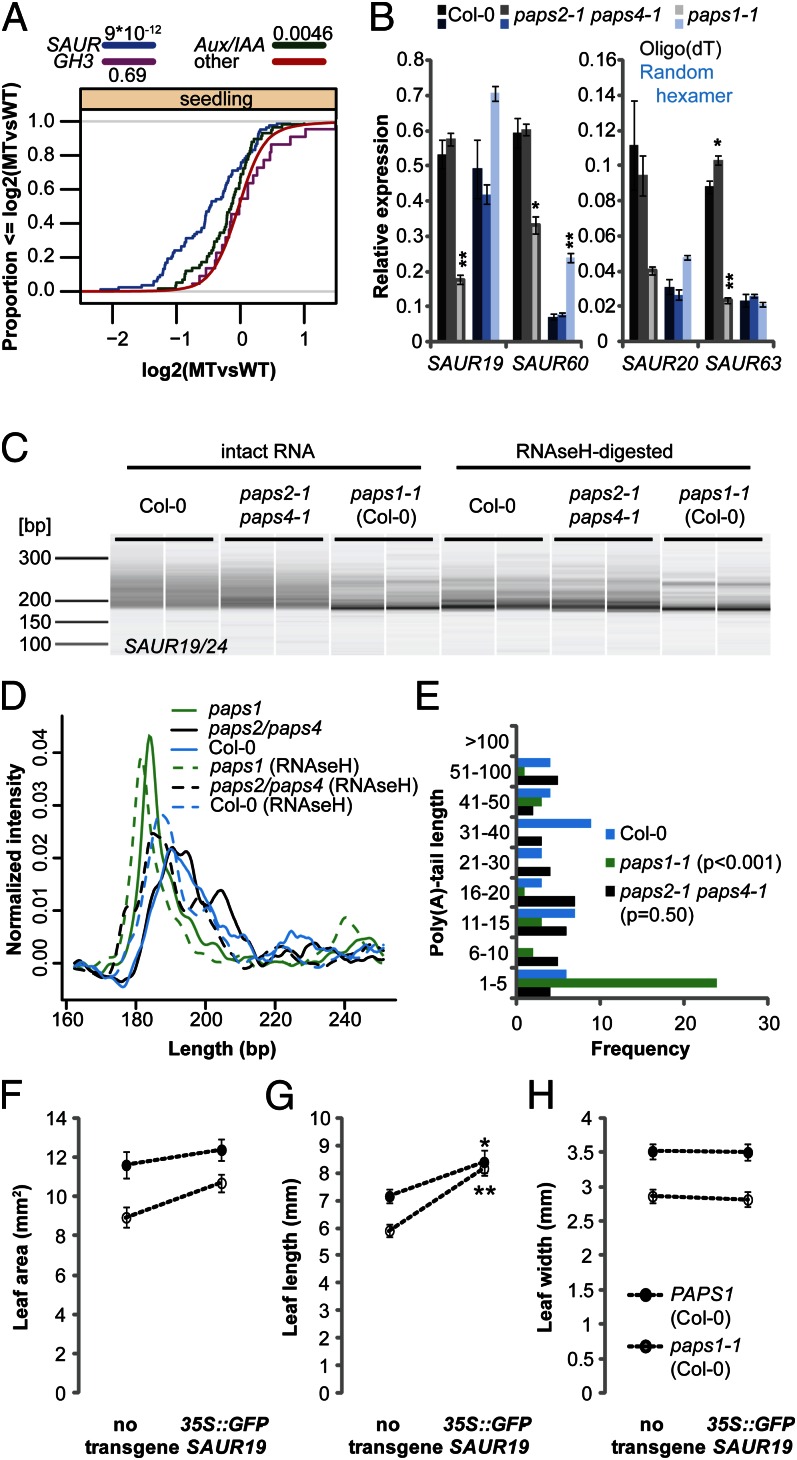
Fig. 3.
Defective polyadenylation of SAUR mRNAs in paps1 contributes to reduced leaf growth. (A) Cumulative distribution plot of the expression levels of SAUR, GH3, and Aux/IAA family members in paps1-1 vs. wild-type seedlings. The y axis indicates the fraction of genes with a log2-expression ratio less than or equal to the value on the x axis. Numbers in legend are P values of a Wilcoxon rank-sum test. “other,” all remaining genes on the array. (B) Expression of the indicated SAUR genes in paps1-1 and paps2-1 paps4-1 mutant seedlings compared with wild-type. Values from oligo(dT)-primed cDNA are shown in gray shades, those from random hexamer-primed cDNA in blue shades. Values shown are the means ± SE from three (Col-0 and paps2-3 paps4-3) or two (paps1-1) biological replicates, normalized to the constitutive reference gene PDF2 (AT1G13320). Plants had been kept at 30 °C for 2 h before harvesting. *P < 0.05; **P < 0.01 (Student t test). (C) Bioanalyzer electropherogram of RT-PCR–amplified 3′ ends of SAUR19/24 transcripts from the indicated genotypes. Two biological replicates per genotype are shown. RNA had been left untreated (Left) or poly(A) tails had been digested with RNAseH and oligo(dT) (Right) before reverse transcription. (D) Normalized signal intensities of the PCR products in C. Averages of the two biological replicates per genotype are shown. (E) Length distribution of poly(A) tails as determined by sequencing subcloned individual PCR products from intact RNA in C. P values in legend are from a Wilcoxon rank-sum test. (F–H) Leaf area (F), length (G), and width (H) of wild-type or paps1-1 mutant plants with or without the 35S::GFP-SAUR19 transgene. Asterisks (*,**) indicate significant difference from value in the absence of the transgene at P < 0.05 (*) or P < 0.01 (**) according to t tests with Bonferroni correction.

