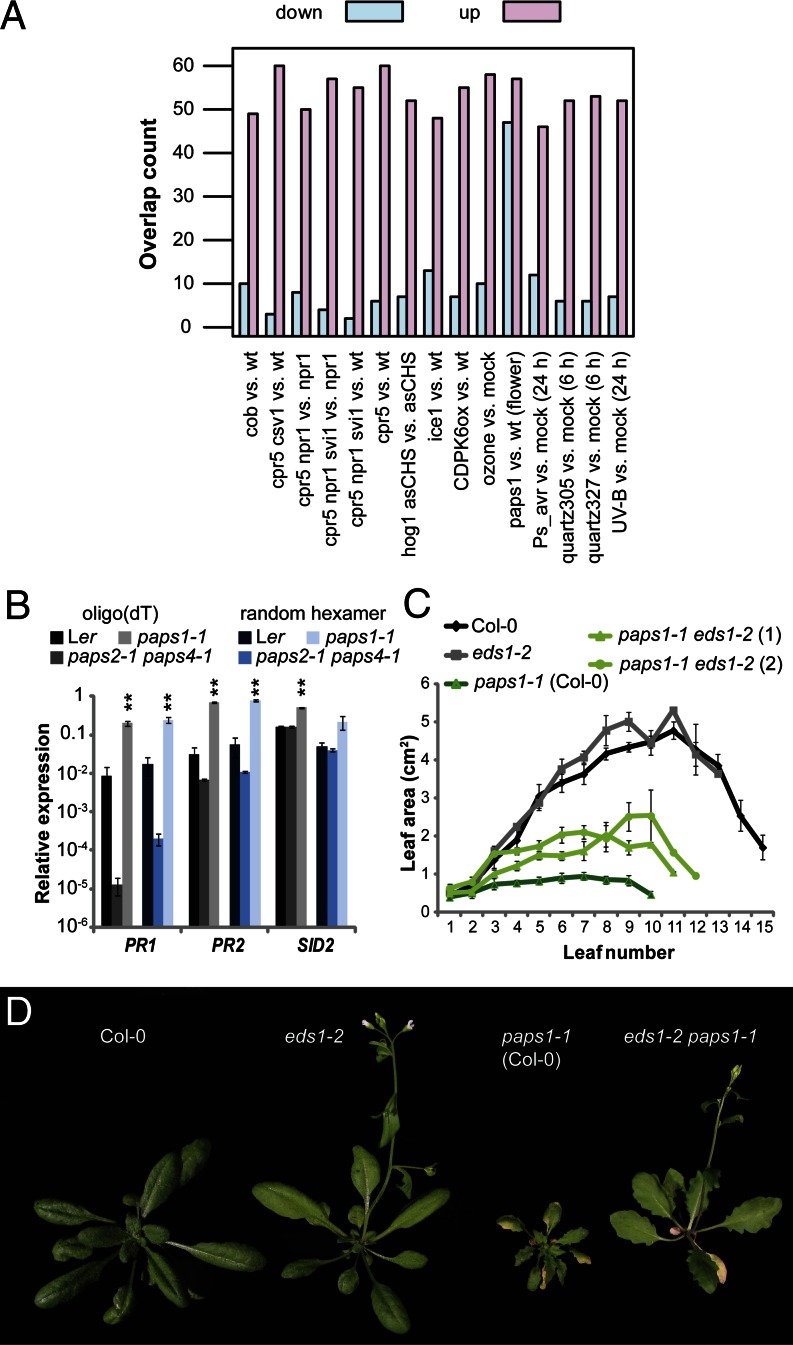
Fig. 4.
Reduced leaf growth in paps1 is partly due to an EDS1-dependent pathogen response. (A) Overlap of genes misregulated in leaves of paps1-1 mutants vs. wild-type with genes misregulated in the experiments indicated. “Down” and “up” refer to the direction of the expression change in paps1-1 vs. wild type. Table S3 defines the abbreviations used. (B) Expression of the indicated genes in paps1-1 mutant seedlings compared with wild-type, using oligo(dT)-primed (gray shades) or random hexamer-primed cDNA (blue shades). Values shown are the means ± SE from three biological replicates, normalized to the constitutive reference gene PDF2 (AT1G13320). (C) Quantification of leaf area in the indicated genotypes. Values shown are means ± SE from at least three plants per genotype. (D) Whole-plant phenotypes of the indicated genotypes.

