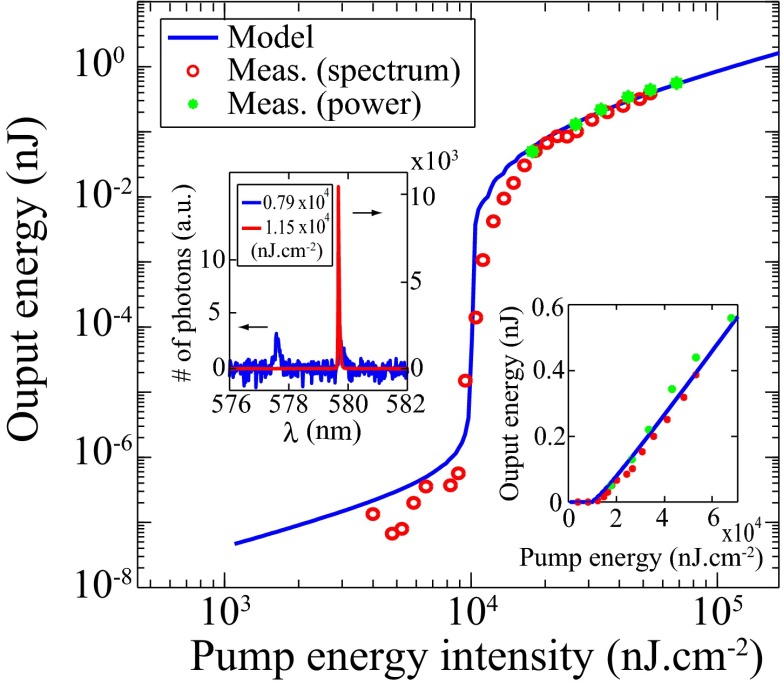
Fig. 4.
Low-threshold lasing of a 100-nm thin layer of R6G molecules in solution. Input–output energy characteristics of lasing through mode 4 (580 nm) under pulsed excitation are shown. The solid lines are analytical predictions from our lasing model, whereas the green circles are energies measured (Meas.) with a power meter. Red circles are measurement results using the spectrometer multiplied by an arbitrary constant for the simplicity of comparison. The jump in output power clearly indicates the onset of lasing. (Lower Inset) Same results in linear scale, where the output grows linearly with the pump energy beyond threshold. (Upper Inset) Measured spectrum of emission from the PhC slab at normal direction when pumped below (blue) and above (red) the lasing threshold. Single-mode lasing is attained at approximately  (corresponding to an intensity of
  ).
).

