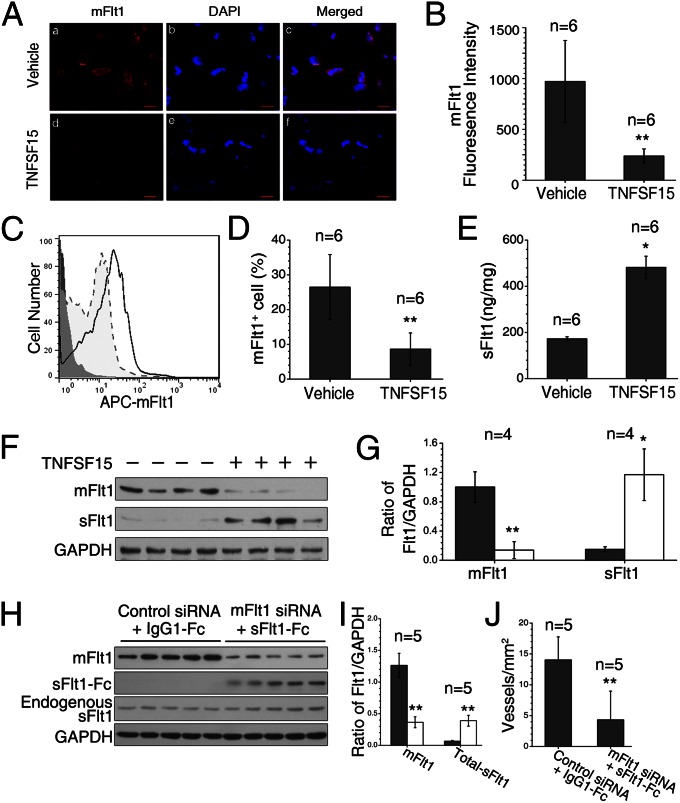
Fig. 2.
TNFSF15-facilitated down-regulation of mFlt1 and up-regulation of sFlt1 in EPC in Matrigel plugs. (A) Fluorescent confocal microscopic images of mFlt1 staining of frozen Matrigel sections. Red, mFlt1+ cells. Blue, nuclei. (Scale bar, 50 μm.) (B) Quantitative analysis of fluorescence intensities of mFlt1+ cells. (C) FACS analysis of isolated EPC. Solid line, vehicle-treated. Dotted line, TNFSF15-treated. Gray line, isotype-matched antibody staining. (D) Percentages of mFlt1+ cells determined by flow cytometry. (E) Concentrations of sFlt1 in supernatants of digested plugs, determined by ELISA. (F) mFlt1 and sFlt1 protein levels in individual plugs by Western blot. (G) Densitometry analysis of mFlt1 and sFlt1 protein bands in F. (H) mFlt1, sFlt1-Fc, and endogenous sFlt1 protein levels in individual gel plugs by Western blot. (I) Densitometry analysis of the protein bands in H; total sFlt1 indicates the sum of sFlt1-Fc and endogenous sFlt1. (J) Blood vessel densities in the gel plugs. The experiments were repeated two times. Numbers on top of bars indicate the numbers of animals per group. Data are mean ± SD. *P < 0.05, **P < 0.01, Student t test.

