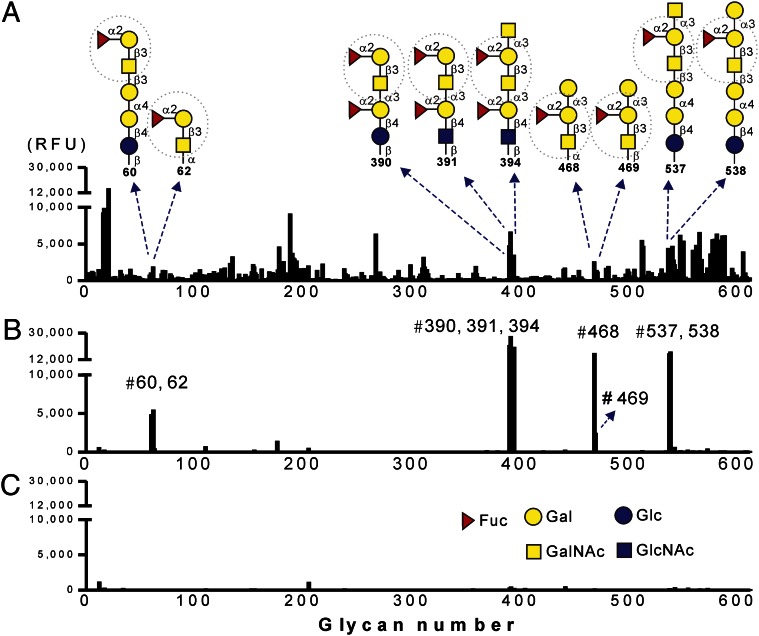
Fig. 1.
Glycan-binding patterns of the serum IgM antibodies as measured by the CFG glycan microarray. Each histogram represents different sources of IgM binding to the glycan microarray, where the x axis shows the glycan number of 611 saccharides examined and the y axis is relative fluorescent units. Serum samples (tested at 1:100 dilution) from F3-treated (A), FMS-treated (B), and PBS-treated (C) mice were collected on day 14 after four dose injections and analyzed by printed array Version 5.0 of the CFG Core H. Nine of the identified glycan structures marked with glycan numbers are indicated. Dashed circles indicate the consensus glycan epitope (H-type 3/4 structure). Bars show the average RFUs [n = 4 (A and B); n = 2 (C)].

