Fig. 1.
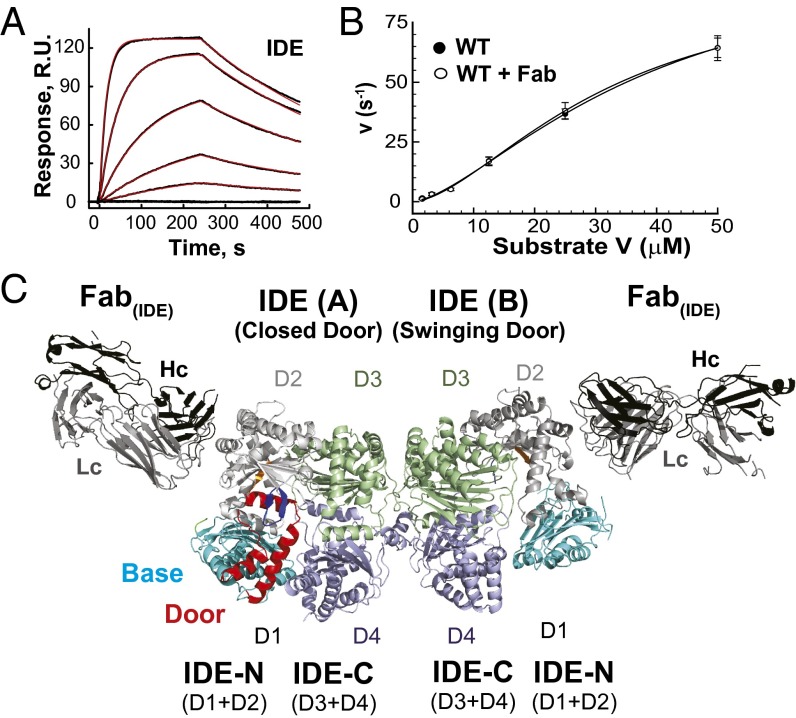
Functional properties of Fab(IDE) and structure of IDE-Fab(IDE) complex. (A) Sensorgram traces for the interaction of Fab(IDE) to immobilized IDE. Black lines show experimental data, and red lines display the best fit of the global 1:1 Langmuir model, which resulted in association [ka = 2.18 ± 0.02 (×105) M−1s−1] and dissociation (kd = 5.87 ± 0.05 (×10−3) s−1] rate constants and the derived equilibrium constant (KD = 3.72 ± 0.03 nM). (B) Fab(IDE) does not affect IDE catalytic activity. Catalytic activity of IDE in the absence and presence of the equal molar Fab(IDE) was measured at varying concentrations of Substrate V. Data points represent mean ± SD (n = 3). A sigmoidal curve (Hill equation with Hill coefficient = ∼2) was fit to each data set. (C) Ribbon representation of IDE-Fab(IDE) structure [Protein Data Bank (PDB) ID 4IOF]. The base, door, P-loop, G-loop, H-loop, D2, D3, and D4 of IDE are colored cyan, red, green, orange, blue, light gray, light green, and light blue, respectively, and such color scheme is used throughout the article. Heavy and light chains (Hc and Lc) are colored black and gray, respectively.

