Fig. 2.
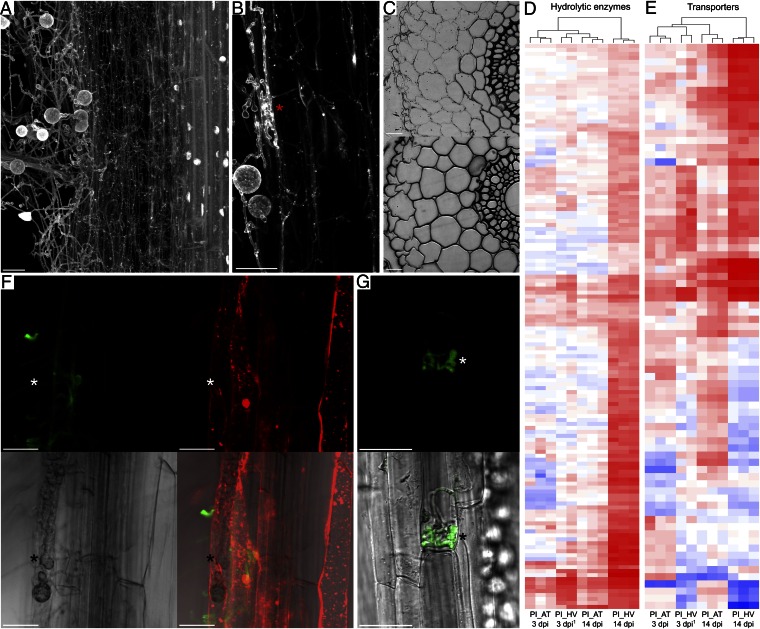
Colonization patterns and P. indica gene expression polymorphisms correlate with extended biotrophy in Arabidopsis (AT) and with a switch from biotrophic to saprotrophic nutrition during colonization of barley (HV). (A) Maximum projection of a barley root colonized by P. indica at 30 dpi. Broad extraradical hyphae are visible at the boundary of the epidermis, whereas thin secondary hyphae are filling the cortical cells. Host nuclei are absent in the cortex cells while the cylinder is undamaged and preserves intact nuclei. The root was stained with acid fuchsine. (B) Closer view of biotrophic broad invasive hyphae within a barley epidermal cell and secondary hyphae in cortical cells (*). (C) Transverse 4-μm sections of barley roots inoculated with P. indica (30 dpi), stained with toluidine blue. (Upper) Heavily colonized cortex cells. (Lower) A noncolonized part of the root. (D and E) Heat map showing log2-fold expression changes of P. indica genes encoding (D) hydrolytic enzymes and (E) transporters. Significant (t test, P < 0.05) log2-fold expression changes were calculated vs. PNM control. A consistent divergence is observed at 14 dpi, where a strong induction is visible for most of these genes during colonization of barley only (for a detailed overview, see Dataset S1). 1Raw expression data for barley 3 dpi were retrieved from ref. 8. Color coding indicates up-regulation (red) and down-regulation (blue) of genes. (F) Biotrophic broad invasive hyphae (white *) in Arabidopsis epidermal cell at 14 dpi. In contrast to extracellular hyphae, invasive hyphae are not stainable with WGA-AF488 (green) because of the presence of a plant-derived membrane. Endomembrane structures stained by FM4-64 (red) are visible inside the plant cells, indicating cell viability. (G) Arabidopsis epidermal cell with biotrophic invasive hyphae (white *) of P. indica GFP strain (14 dpi). The scale bars represent 25 µm.

