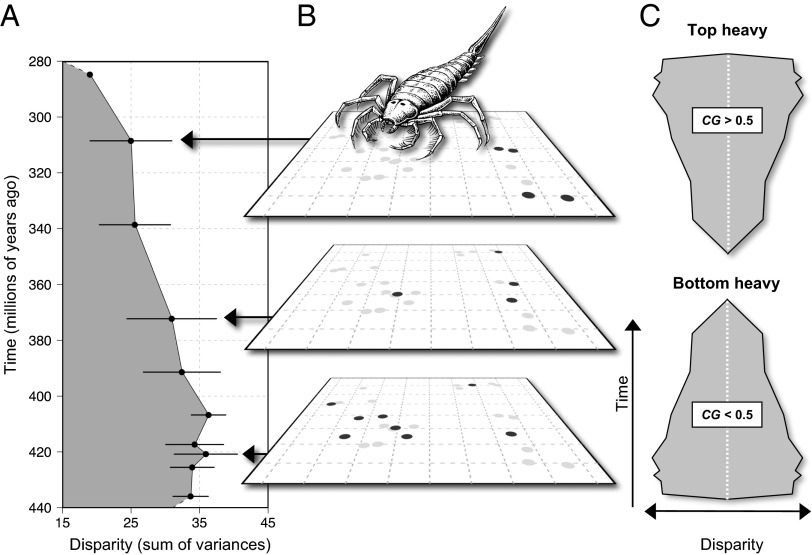
Fig. 1.
Calculating the disparity profile of clades. (A) Disparity of Stylonurina (74) measured as the sum of variances on successive principal coordinate analyses at several time intervals. Mean of 1,000 bootstrap replicates ± SE. (B) Distribution of taxa on the first two principal coordinates of their empirical morphospace at three of the time intervals. Black symbols indicate taxa present in the interval; gray symbols indicate taxa present in other intervals. (C) Stylized representations of significantly top-heavy (Upper) and bottom-heavy (Lower) asymmetrical clade disparity profiles.

