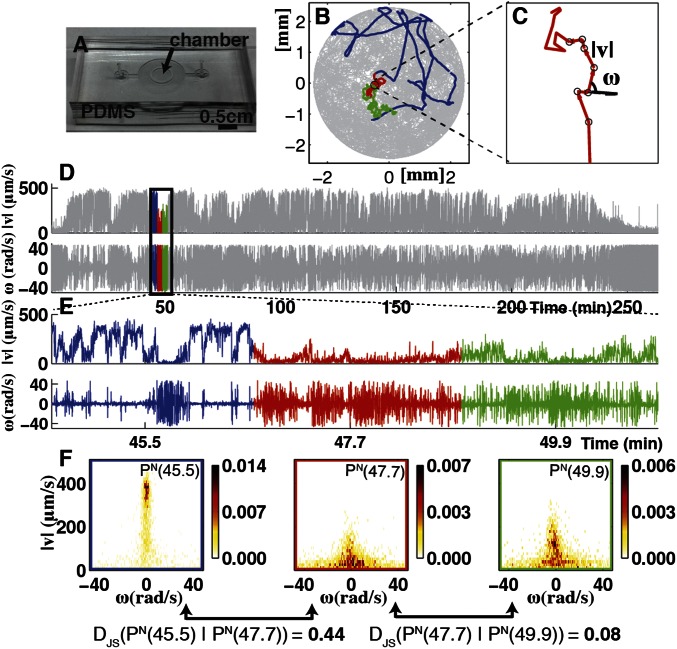
Fig. 1.
Full-lifetime tracking of swimming behavior in T. thermophila and defining behavioral states. (A) An example of a microfluidic device used in this study. Tetrahymena are loaded into the circular central chamber (Experimental Procedures). (B) The 4-h full-lifetime swimming trajectory of an individual confined to a chamber like the one shown in A is shown in gray, and a 6-min portion is divided into three segments of equal duration (blue, red, green). Full trajectories of (x, y) coordinates (B) are transformed into a time series of speeds and angular velocity  . (C) A short segment of trajectory illustrates the calculation of
  and
and  . (D) The result of such a transformation for an entire time series. (E) An expanded view of the
  and
and  time series for the colored segments of the trajectory in B and D. (F) Histograms of
  and
and  for each of the three segments of swimming trajectory in E. The faster, straighter swimming in the blue segment is apparent as the narrow peak of density centered around
  (rad/s) and
  . Although the slower, higher tortuosity swimming behavior in the red and green segments is evident as the density below
  with a greater range of
  . For a segment centered at time t of individual N, its histogram is denoted
  . We refer to each histogram as a “behavioral state”. Color bars reflect the density in each histogram. Differences between behavioral states are measured by the Jensen–Shannon divergence, denoted
  . For the dissimilar blue and red segments
  whereas for the more similar red and green segments
  .
.

