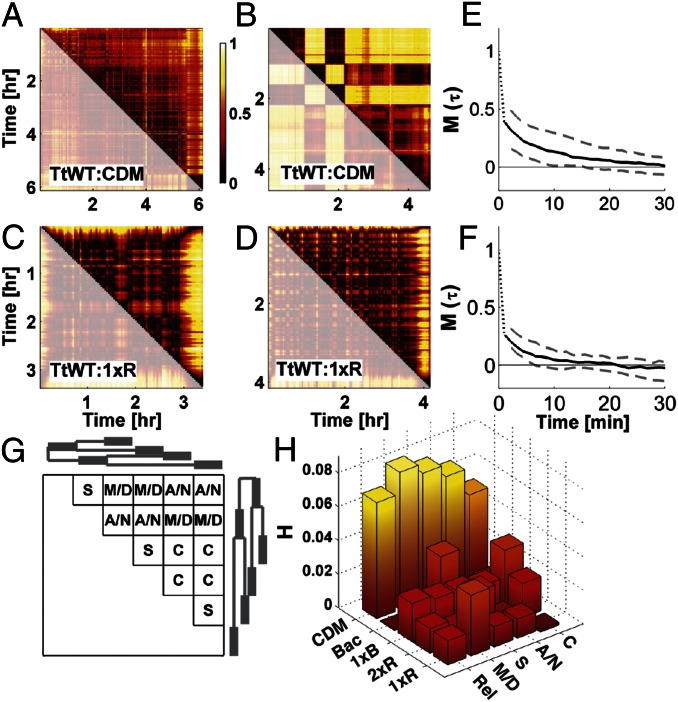
Fig. 4.
Behaviors are dynamically heterogeneous over a lifetime and between generations. (A–D) Examples of changeability matrices from four WT T. thermophila (TtWT) individuals in two conditions—two from CDM and two from 1xR. Color scale for all matrices is shown to the right of A and the dimensions of each matrix are time. Because these matrices are symmetric, redundant data are gray. E and F show the memory  , defined in the main text, for populations (30 individuals) in CDM and 1xR, respectively. Black lines indicate the median (across the population) and dashed lines the 0.1 and 0.9 quantiles. Data for a short time before and after divisions are discarded for this calculation. G shows a schematic individuality matrix for a family of six (“related”) individuals arising from a single progenitor. Heritability (H) is defined in the main text as the difference in median individuality between related and unrelated individuals (from different families). The difference between these two quantities is shown in the row labeled “Rel” in H for the five conditions where the TtWT strain was measured. The calculation is repeated, subdividing related individuals into mother–daughter pairs (M/D), sisters (S), aunt–niece (A/N) pairs, and cousins (C). This subdivision is shown schematically in G for a family of six individuals; the phylogeny of a family is shown to the left and above the individuality matrix. Each row of the heritability matrix shown in H corresponds to one such subdivision labeled at the lower right. All measurements of heritability are significant at the 5% level, using a Wilcoxon rank sum test.

