Fig. 1.
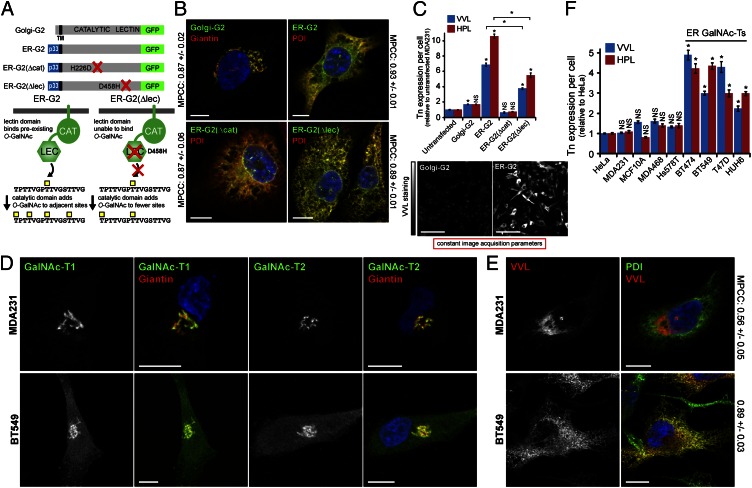
ER-localized GalNAc-Ts drive high Tn expression. (A) Schematic of GalNAc-T2-GFP constructs used in this study. (B) Golgi-G2 and ER-targeted chimeras colocalize with Golgi (Giantin) and ER (PDI) markers, respectively. (Scale bars, 10 µm.) (C) Mean Tn expression ± SEM in model GalNAc-T2 cells. *P < 0.01 relative to untransfected. NS, not significant. (Scale bars, 100 µm.) (D) GalNAc-T1 and -T2 staining in cells with low (MDA231) or high (BT549) Tn levels. Golgi stained with Giantin. (Scale bar, 10 µm.) (E) Costaining Tn with VVL and ER with anti-PDI antibody. (Scale bars, 10 µm.) (F) Mean of Tn expression ± SEM in cancer cells. *P < 0.01 relative to HeLa cells. Nuclei stained using Hoechst.

