Fig. 2.
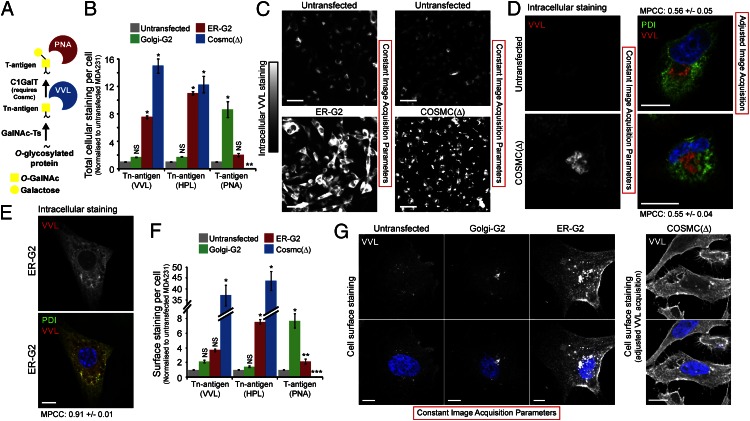
Loss of C1GalT activity and ER localization of GalNAc-Ts result in distinct glyco-phenotypes. (A) Schematic of O-GalNAc glycosylation pathway and lectin reactivity. (B and C) Mean expression ± SEM of T and Tn antigens in genetically modified MDA231. *P < 0.01 (ANOVA) and **P < 0.01 (t test) relative to untransfected cells. (D) Costaining VVL and PDI in Cosmc(Δ) and untransfected MDA231 cells. Weaker VVL staining in untransfected cells required adjusted acquisition. (Scale bars, 10 µm.) (E) Costaining VVL and PDI in ER-GalNAc-T2 cells. (Scale bar, 10 µm.) (F and G) Mean cell surface expression ± SEM of T and Tn antigens in genetically modified MDA231. (Scale bars, 10 µm.) *P < 0.01, **P < 0.05 (ANOVA), and ***P < 0.01 (t test) relative to untransfected cells. Nuclei stained using Hoechst.

