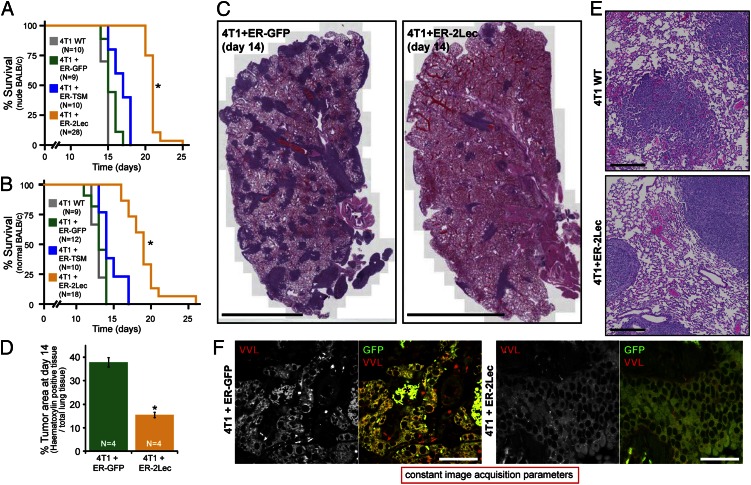
Fig. 7.
Inhibiting ER-localized GalNAc-Ts lowers the invasiveness of 4T1 carcinoma cells in vivo. (A and B) Kaplan–Meier survival curves for nude (A) and nonnude (B) BALB/c mice injected with model 4T1 cells. *P < 0.0001 relative to 4T1-WT, 4T1-ER-GFP and 4T1-TSM (Log rank). For statistical comparison of wild-type and ER-2Lec curves: χ2 = 41.4 (nude) and 32.1 (nonnude); hazard ratio = 5.8 (nude) and 5.6 (nonnude). (C) H&E staining reveals metastatic nodules (dark purple) in the lung parenchyma of mice injected with model 4T1 cells. (Scale bars, 2 mm.) (D) Mean percentage of tumor area over total lung surface ± SEM in mice (n = 4) injected with transgenic 4T1 cells. *P < 0.01 relative to 4T1-WT cells. (E) Zoom-in illustrating the morphological differences between nodules. (Scale bars, 200 µm.) (F) Tn staining (VVL) of the lung parenchyma of mice injected with 4T1-ER-GFP and 4T1-ER-2Lec cells. 4T1 cells are marked by GFP fluorescence. (Scale bars, 50 µm.) An asterisk represents erythrocytes.

