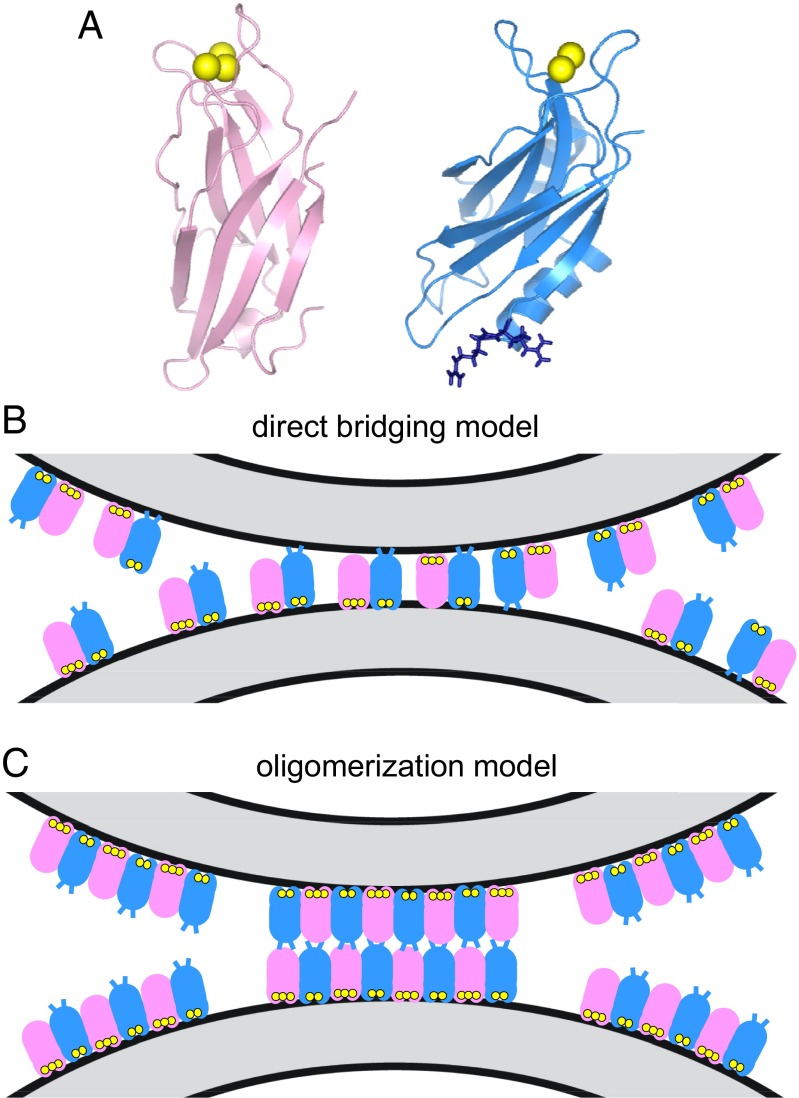
Fig. 1.
Two models of membrane bridging by synaptotagmin-1. (A) Ribbon diagrams of the synaptotagmin-1 C2A domain (40) (Left) and C2B domain (15) (Right). Ca2+ ions are shown as yellow spheres. The two arginines at the bottom of the C2B domain (R398 and 399) are shown as blue stick models. (B) Direct-bridging model whereby the C2 domains bind simultaneously to the two apposed membranes, resulting in an intermembrane distance of ∼4 nm. The C2A and C2B domains are shown in pink and blue, respectively, with the Ca2+ ions bound to the top loops in yellow; the R398 and R399 side chains at the bottom of the C2B domain are represented by blue lines. The diagram is meant to illustrate that the two C2 domains can have parallel or antiparallel orientations, with the Ca2+-binding loops binding to the same membrane or to opposite membranes; R398 and R399 can cooperate in bridging in both orientations, but are more critical for bridging in the parallel orientation. Bridging requires multiple C2AB molecules but does not involve interactions between them (20). (C) Oligomerization model whereby bridging is mediated by trans interactions between oligomers bound to separate membranes, resulting in an intermembrane distance of ∼8–9 nm. The model postulates that only the Ca2+-binding loops contact the membranes, whereas R398 and R399 do not, instead mediating protein–protein interactions (29). The putative binding mode between oligomers is unknown, and hence the model of interactions between the bottom sides of the C2 domains shown is arbitrary.

