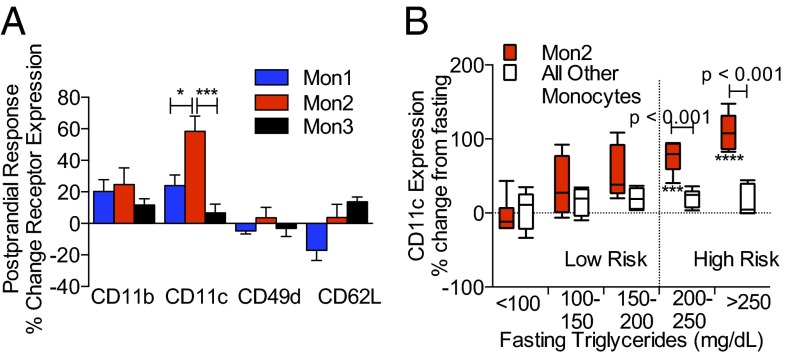
Fig. 1.
Adhesion receptor expression on monocyte subsets in a fasting and postprandial state. (A) Receptor expression on monocyte subsets as labeled in postprandial subjects 3.5 h after consumption of a high-fat meal. Data are expressed as the percent change in receptor expression relative to fasting state. Significance was determined using a one-way ANOVA with a Tukey posttest, *P < 0.05, ***P < 0.005. (B) CD11c receptor expression on Mon2 versus Mon1 and Mon3 plotted as a function of fTGs. Subjects were categorized into low-risk (n = 15) or high-risk (n = 11) groups based on fTGs and postprandial change in CD11c. Subjects with fTGs ≥200 mg/dL were grouped as high risk (right of horizontal dashed line). Data are representative of 26 subjects (10 female). Significant changes in CD11c expression were determined using a repeated measures ANOVA with Dunnets posttest, ***P < 0.005, ****P < 0.001. Significance comparing Mon2 to other monocytes was determined using a one-way ANOVA with a Tukey posttest.

