Fig. 6.
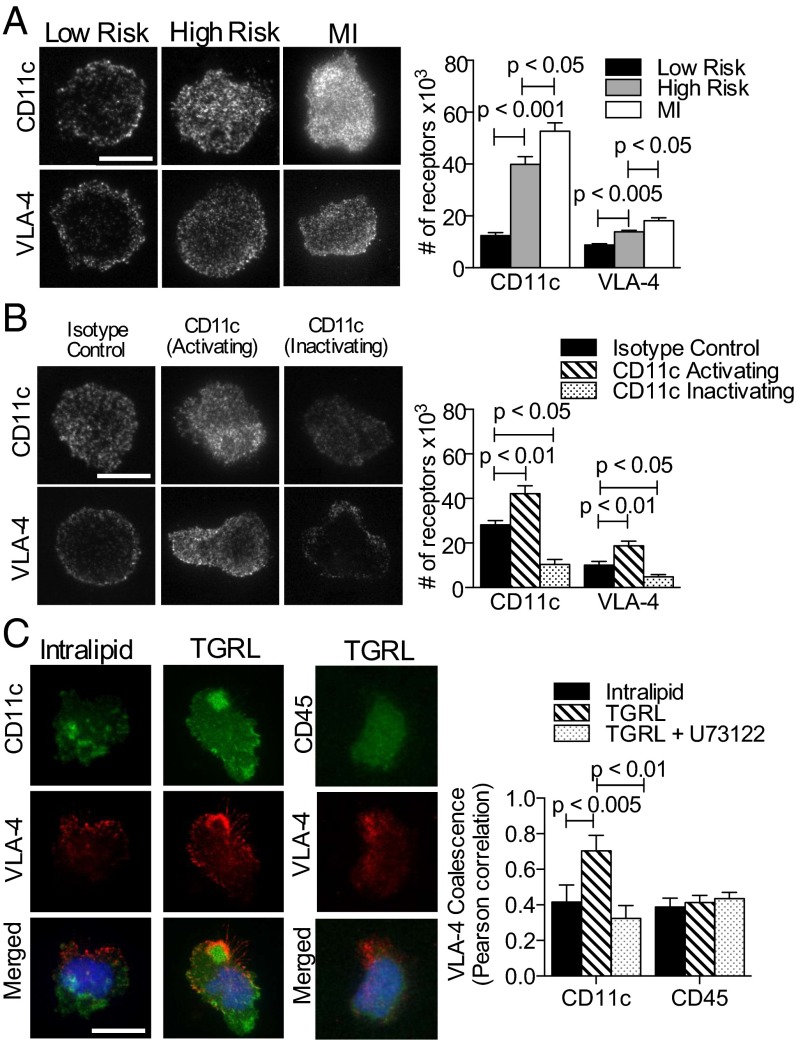
CD11c and VLA-4 density and topography on monocytes at adhesive contact with VCAM-1. (A) TIRF images of anti-CD11c and anti–VLA-4 reveal receptors in contact with VCAM-1 acquired from postprandial study subjects; low-risk (n = 4), high-risk (n = 5), and MI patients (n = 5) (images are representative of 20–30 monocytes per subject). (Scale bar, 10 μm.) Receptor number was quantified using calibration beads as described in SI Materials and Methods. (B) TIRF images of CD11c and VLA-4 on monocytes treated with allosteric antibody 496B-activation, 496K-inactivation, or an isotype control antibody (images are representative of 20–30 monocytes per condition). (Scale bar, 10 μm.) Number of CD11c and VLA-4 receptors on arrested monocytes from healthy donors (n = 5). Monocytes in blood were treated with 496B, 496K, or isotype control prior to the adhesion assay. (C) Integrin colocalization on VCAM-1 was imaged by TIRF microscopy on monocytes incubated with TGRL or control Intralipid, and a group was pretreated with the PLC inhibitor U73122 (images are representative of 15–20 monocytes per condition). VLA-4 (red) coalescence with CD11c (green) or VLA-4 with CD45 at the contact site was quantified using Pearson’s coefficient. Significance was determined by one-way ANOVA with Tukey posttest.

