Fig. 4.
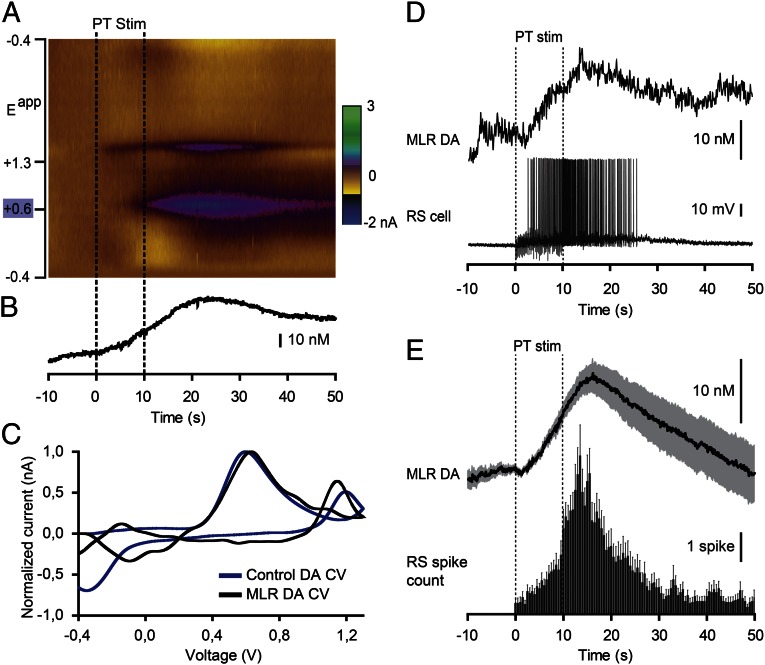
Stimulation of the PT evokes DA release in the MLR together with reticulospinal (RS) activity. (A) DA release evoked by PT stimulation (PT Stim, 10-s train, 5 Hz, 15 µA, 2-ms pulses) in an isolated brain preparation (stimulation period = 0–10 s). The color plot depicts current changes (in color) across the applied voltages (Eapp; i.e., ordinate) over time (i.e., abscissa). DA is identified by its oxidation peak (∼0.6 V) that appears during PT stimulation. (B) Changes in DA concentration in the MLR extracted from A. (C) Plots of normalized current vs. voltage. The DA electrochemical signal (cyclic voltammogram; CV) recorded from the MLR in A (black) is similar (R = 0.82, P < 0.001) to that measured from a 1-µM control DA solution (blue) bath-applied following the experiment, thus confirming DA detection. (D) The DA release in the MLR elicited by PT stimulation was positively correlated with the number of spikes evoked in reticulospinal cells. (E) Changes in DA concentration plotted vs. the number of reticulospinal spikes per unit time (bin represents 500 ms) in the same trials (n = 30 stimulations from six preparations). Mean ± SEM are illustrated.

