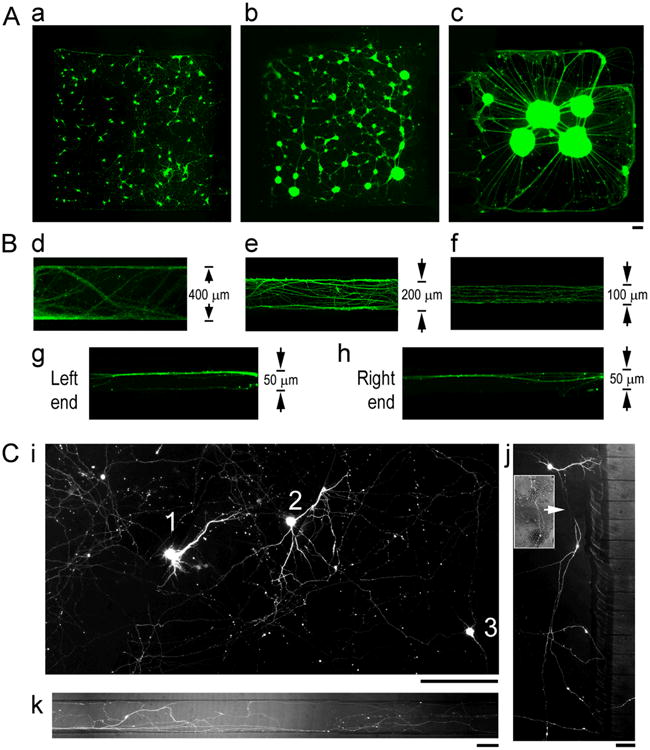
Figure 2. Dimension designs of neuronal cell and axon compartments.

(A) Fluorescence photographs of Calcein-AM stained (green) neuronal cultures at DIV 16 in a 1.5 by 1.5 mm mini-well of different plating densities, 130 k/cm2(a), 530 k/cm2(b), 1 mil/cm2(c). Scale bar: 100 μm (B) Fluorescence photographs of β3TB-immunostained axons at DIV 16-21 in microchannels of different widths, 400 μm (d), 200 μm (e), 100 μm (f), and 50 μm (g) of the Left end (g), and the Right end (h) of a channel. (C) Representative fluorescence photograph of GFP+ neurons and axons in a circuit, showing complex axon trajectory. (i) Three GFP+ neurons (“1”, “2”, “3”) in an entire region of a mini-well. (j) A GFP+ neuronextending its axon (arrow) into a distant microchannel bypassing nearby channels. Inset shows overlay of GFP+ axon segment onto phase contrast image of a dense neuronal culture in the background. (l) Multiple GFP+ axon processes derived from a same neuron in a 100 μm channel. Scale bars: 100 μm.
