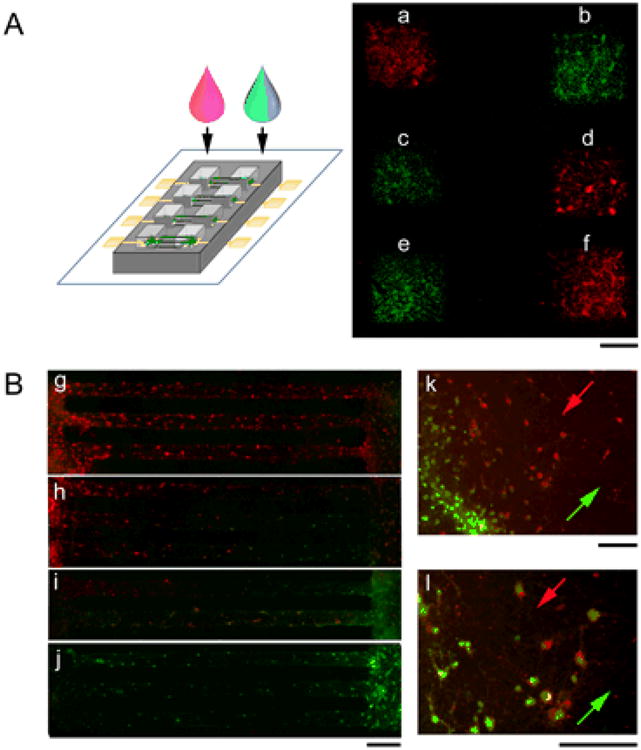
Figure 3. Local drug application to targeted neuronal populations at different nodes of a circuit.

(A) Left: Schematics of applying dye solutions to different mini-wells of a circuit. Right: A representative fluorescence photograph of a substrate with six mini-wells (“a”, ”b”, ”c”, “d”, “e”, “f”) after application of calcein-AM dye solutions of different fluorescence spectrum (red and green), showing little mixing in the microchannels that connected a to b, c to d, and e to f. Scale bars: 500 μm (B) Fluorescence photographs of two connected neuronal populations absorbing DiI (red) and DiD (green) at different time points, the left-side population applied with DiI first and the right-side population with DiO at a later time point with increased delay from the top lane going downward (g, h, i, j). The interface zone where DiI and DiD solutions met (k, l; arrows indicating microfluidic flow direction of DiI, red and DiD, green), show two distinctive populations of neurons that absorbed DiI vs. DiD. Scale bars: 100 μm.
