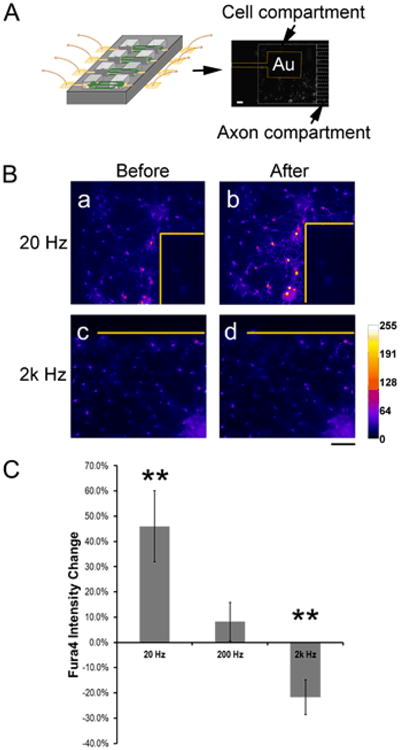
Figure 4. Local electrical stimulation to targeted neuronal populations at different nodes of a circuit.

(A) Left: Schematics of interfacing MEAs of the circuit to a custom-made array of gold pins that connects to a functional generator. Right: A representative fluorescence photograph of fluo-4 stained cortical neurons growing on and near a gold (Au) surface electrode (outlined in yellow). The mini-well and microchannels are outlined in white dashed lines. Scale bar: 150 μm. Scale bar: 150 μm. (B) Representative ‘heat-map’ images converted from fluorescence photographs of fluo-4 stained cortical neurons before and after electrical stimulation, showing increased intensity under 20 Hz (a and b) and diminished intensity under 2000 Hz (c and d). Note the highly localized intensity changes near the Au electrodes (outline in yellow). Scale bar: 100 μm. (C) Quantification of frequency-dependent fluorescence changes of fluo-4 stained neurons (20 Hz, n = 14, p = 0.008; 2k Hz, n = 6, p = 0.53; **, p<0.01, Student's t-test, compared to before stimulation).
