
Figure 5.
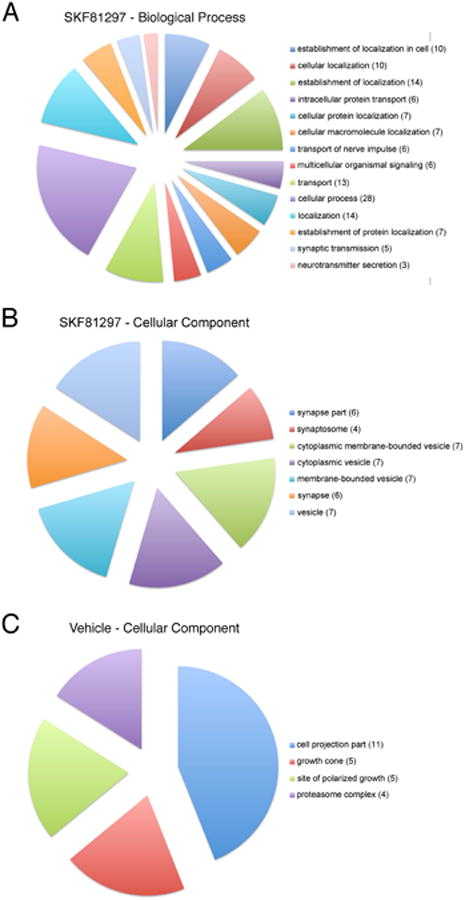
Gene ontology analysis of the dopaminergic hippocampal subproteome. (A+B) Pie charts depicting the representations of the two GO categories biological processes (A) and cellular compartments (B) for the candidates of the SKF81297-treated samples. (C) Vehicle-treated candidates, although larger in total number, can be attributed only to a single GO category (cellular compartment) with 4 GO subcategories. Numbers in brackets indicate the number of candidate proteins within the GO subcategory.