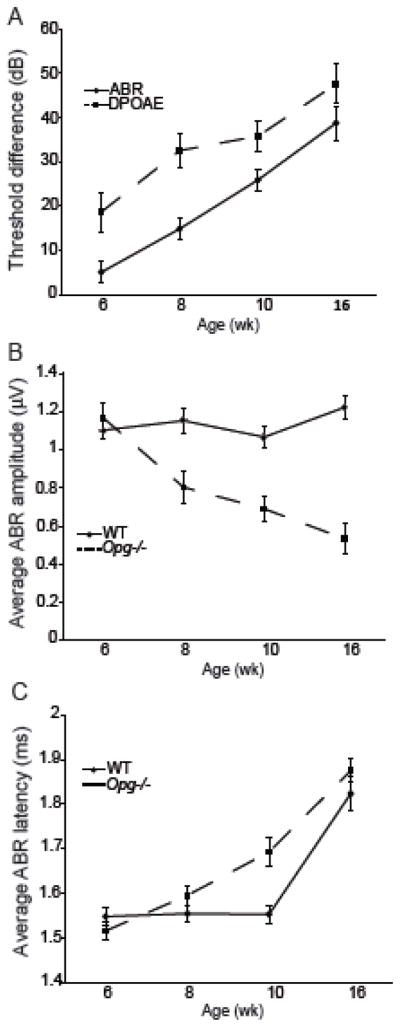
Figure 3. Sensorineural hearing loss in OPG deficient mice.

Measurements of ABR and DPOAE determined threshold shifts (A) in Opg−/− compared to WT mice as a function of age. Data are the average thresholds from 11.32, 16, and 22.64 kHz. Error bars present the standard error of the difference between sample means. N=7, 4, 8, and 5 (Opg−/− mice) or 7, 8, 7, and 5 (WT mice) for 6, 8, 10, and 16 wk, respectively. ABR wave 1 amplitude (B) data are the average responses to 11.32, 16, and 22.64 kHz tones presented at 60, 70, and 80 dB SPL. ABR wave 1 latency values (C) are the averaged peak latencies values in response to 11.32, 16, and 22.64 kHz tones presented at 5, 10, 15 and 20 dB above threshold.
