
Figure 1.
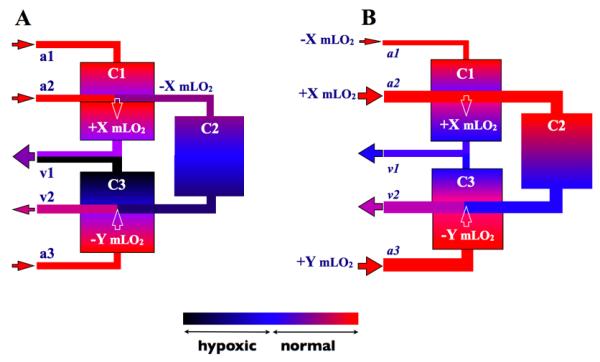
Schematic of three capillary beds (rectangles labeled C1, C2 and C3) supplied by three terminal arterioles (A1, A2 and A3) and draining into two collecting venules (V1 and V2). Color coding of vessels and capillary beds represents O2 levels as indicated in colorbar. The label hypoxia in this context means any O2 level below the normal range. Solid arrowheads indicate the direction of blood flow. White arrowheads indicate the direction of diffusive O2 transport either adding X ml O2/sec to capillary network C1 from A2 or removing Y ml O2/sec from capillary network C3 by V2. Panel A illustrates the wide range of the distribution of O2 among these vessels and capillary beds without regulation of O2 supply. All of capillary network C2 is shown as hypoxic while only the venular region of network C3 is hypoxic. C1 has higher than normal O2 levels. Panel 2 shows the ideal situation with regulation of O2 supply ensuring the appropriate distribution of O2 supply to each of the terminal arterioles resulting in normal O2 levels in all three capillary beds.