Figure 2.
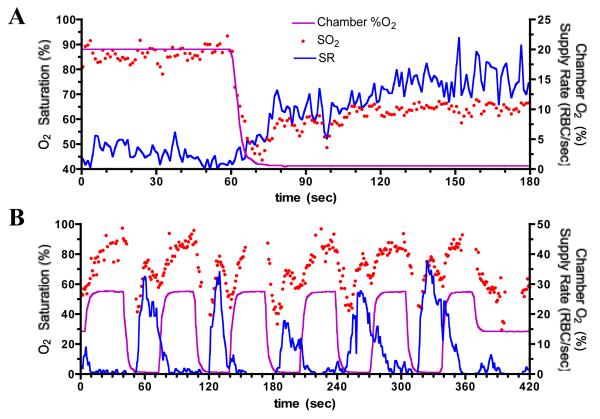
Measured change in erythrocyte (RBC) oxygen saturation (SO2) and supply rate (SR) in two different capillaries near bottom surface of rat EDL muscle in response to step changes in oxygen level in gas exchange chamber (Chamber %O2) inserted into the microscope stage under the muscle. CO2 fixed at 5%, temperature maintained at 32°C. Panel A shows 60 seconds of baseline data at high chamber %O2 followed by a 2 minute period of low chamber %O2 level. Panel B shows a sequence of cycles of chamber %O2 levels, each with 30 sec of high %O2 and 30 sec of low %O2. Note: different scaling of axes between the two panels. In panel A, O2 saturation varies between 40 and 100% (left Y axis) as compared to 0 to 100% in panel B. Supply rate or chamber %O2 (right Y axis) varies between 0 to 25 in panel A and 0 to 50 in panel B.

