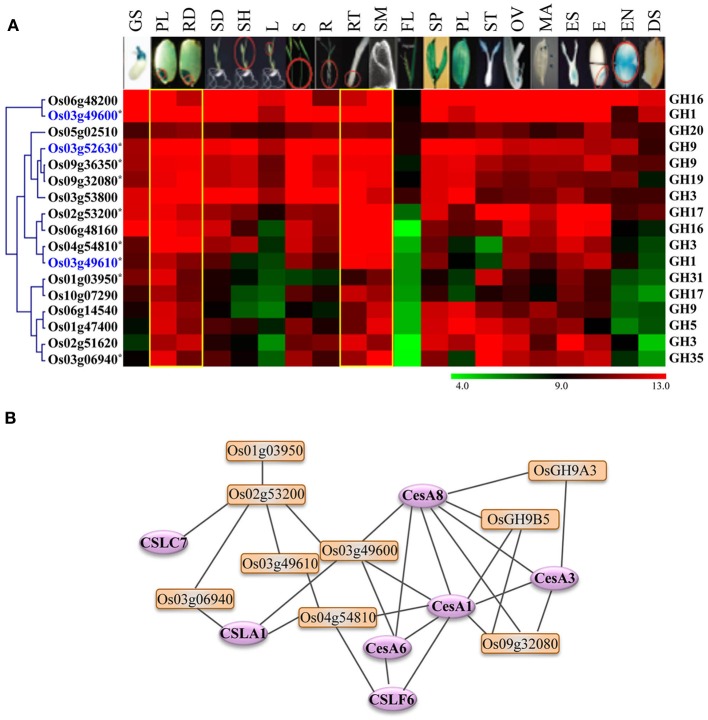
Figure 6.
Expression profiles and co-expression network of GH genes selected as potential targets for biofuel research. (A) Hierarchical cluster display of expression patterns of GH genes exhibiting preferential accumulation in actively growing tissues. The anatomical tissues are given on the top as follows: GS, germinating seedling; PL, plumule; RA, radicle; SD, seedling; SH, shoot; L, leaf; S, stem; R, root; RT, root tip; SAM, shoot apical meristem; FL, flag leaf; SP, spikelet; PL, palea/lemma; ST, stigma; OV, ovary; MA, mature anther; ES, embryo sac; E, embryo; EN, endosperm; DS, dry seed. The color legend is given at the base where green signifies very low-level expression, black indicates medium-level expression, and red represents high-level expression. The numbers in the color legend correspond to relative log2 expression values. The locus IDs are given on the left and gene family names on the right. Locus IDs of monocot-diverged genes are given in blue. (B) RiceNet-predicted association among the GH genes marked by asterisk in panel (A) of this figure (orange boxes) and with the cellulose synthase and cellulose synthase-like genes (purple ellipses) of rice.

