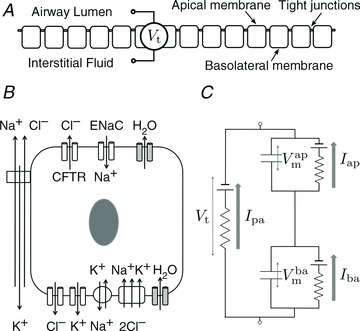
Figure 1. Schematic diagram of epithelial layer (A) and individual epithelial cell (B) separating the airway lumen from the interstitial fluid.

A and B, electrolyte transport occurs across the apical and basolateral membranes, and along the paracellular path through tight junctions. Transport parameters characterise flux through each pathway: CFTR and ENaC channels in the apical membrane are characterised by apical Cl− permeability ( ) and apical Na+ permeability(
 ), respectively; K+ and Cl− channels in the basolateral membrane are characterised by the basolateral K+ (
 ) and Cl− (
 ) permeabilities; the transport parameters for the Na+–K+-ATPase pump proteins and NKCC cotransport proteins in the basolateral membrane are their densities per unit area of the membrane, ρNaK and ρNKCC, respectively. The state of the cell at any time is described by six variables, cell volume (Wi), moles of Na+, Cl− and K+ in the cell (
 , respectively), and apical (
 ) and basolateral (
 ) membrane potentials. C, equivalent electrical circuit representation of airway epithelium.
  and
and  are coupled electrically via the current along the paracellular pathway (Ipa). The trans-epithelial potential difference Vt is given by the difference between lumen and serosal potential (i.e.
  ).
).
