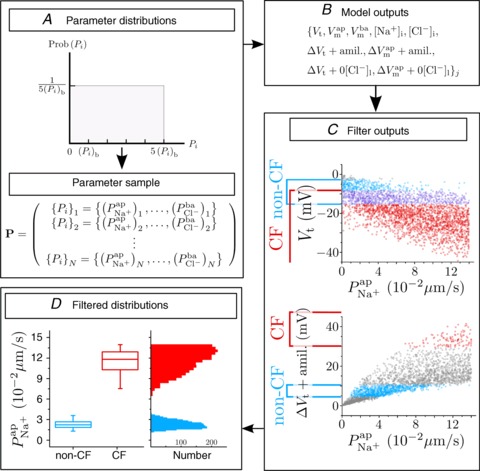
Figure 3. Monte Carlo filtering analysis approach to determine distributions of transport parameter values in CF and non-CF HNE cells.

A, a large sample (N= 106) of parameter sets was generated, each set is a vector  . Each parameter i is sampled from a uniform distribution U(0, 5(Pi)b) around its baseline value (see Table 1). B, for each parameter set {Pi}j, the values of variables Xj at steady state and their value after ‘+amiloride’ and ‘+ 0[ Cl−]l’ perturbations are calculated. C, bounds are placed on the allowed values of these model outputs, for both CF and non-CF states, and parameter sets are classified on this basis. D, filtered parameter distributions can be examined to assess how transport parameters vary between normal and disease states.
