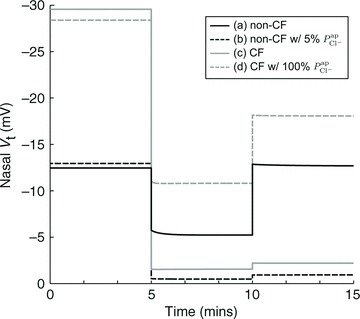
Figure 7. Simulations of first stages of a clinical nasal PD test.

Basal Vt is recorded initially for several minutes, then amiloride is added to the perfusing solution at t = 5 min to block ENaC channels (causing  ), and the resultant change in Vt is recorded. At t = 10 min the solution perfusing the luminal surface is changed to a low Cl− solution ([ Cl−]l→ 3 mm) to introduce a diffusion potential for Cl− efflux, and the resultant change in Vt is recorded. Restoring non-CF
  levels in a CF cell does not correct hyperpolarised basal Vt (grey continuous line → grey dashed line). Also, reducing
  alone to CF levels, in a non-CF cell, does not reproduce a typical CF trace (black continuous line → black dashed line).
