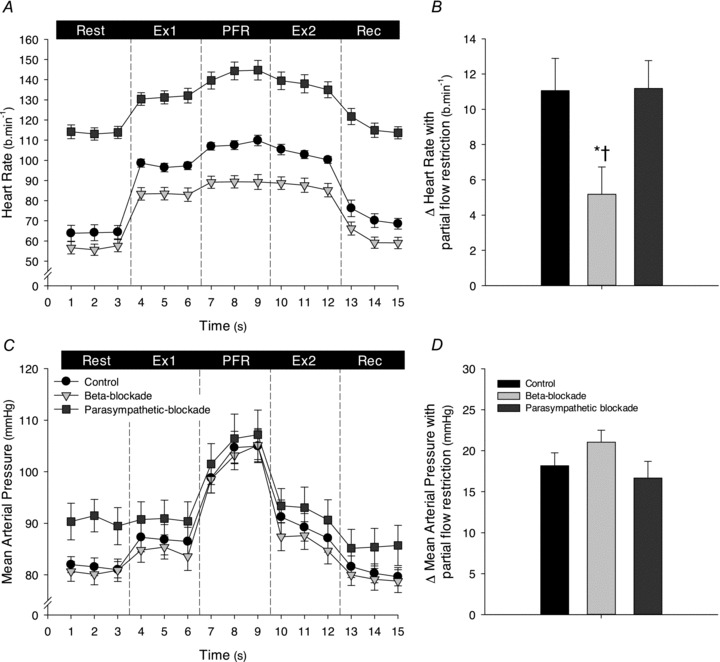
Figure 1. Heart rate (HR) and mean arterial pressure (MAP) during leg cycling before (Ex1) and following (Ex2) partial flow restriction (PFR), for control, β-adrenergic blockade and parasympathetic blockade conditions.

A, 1 min averages of HR during all experimental phases; B, change in HR elicited by partial flow restriction (PFR) from the HR during leg cycling (average of last minute of Ex1 and Ex2). C, 1 min averages of MAP during all experimental phases; D, change in MAP elicited by partial flow restriction (PFR) from the MAP during leg cycling (average of last minute of Ex1 and Ex2). Control, black symbols and bars; β-adrenergic blockade, light grey symbols and bars; parasympathetic blockade, dark grey symbols and bars. Ex1, leg cycling exercise prior to PFR; Ex2, leg cycling following PFR; Rec, recovery. *P < 0.05 vs. control, †P < 0.05 vs. β-blockade.
