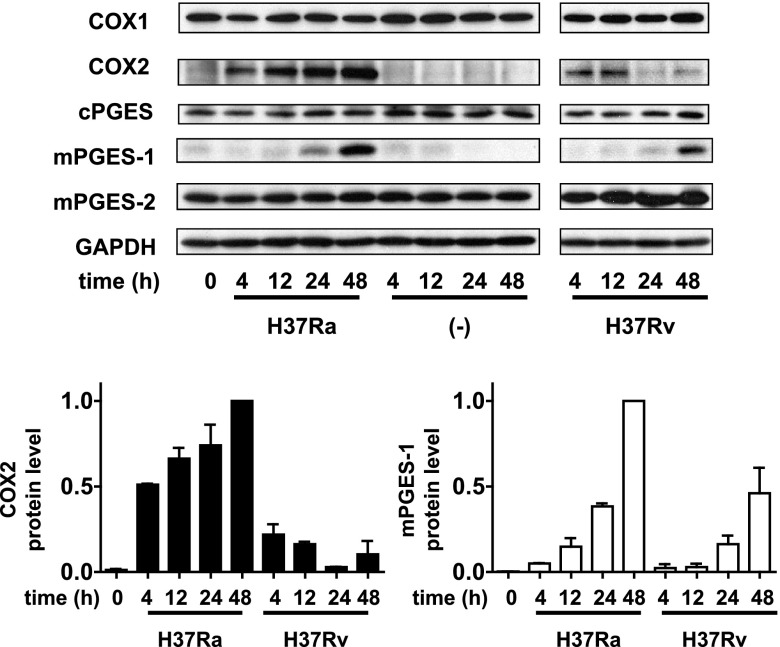
Figure 3.
Top panel: time-dependent protein expression of COX1, COX2, cPGES, mPGES-2, and mPGES-1 in H37Ra- and H37Rv-infected (MOI 10:1) Mφs evaluated by Western blot analysis (n=3). Bottom panels: intensity of the COX2 protein (left panel) and mPGES-1 protein (right panel) was normalized to that of GAPDH and presented as a fold change relative to H37Ra-infected Mφs at 48 h after infection. Values are expressed as means ± sem of 3 independent experiments.

