Figure 7.

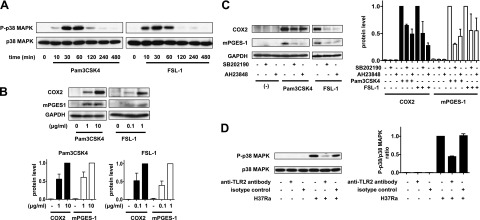
TLR2 stimulation of human Mφs induces COX2 and mPGES-1 expression through the p38 MAPK and EP4 signaling pathways. A) Western blot of p38 MAPK phosphorylation at different time points in Mφs treated with TLR1/2 agonist Pam3CSK4 (10 μg/ml) or TLR2/6 agonist FSL-1 (1 μg/ml; n=3). B) Top panel: Western blot of COX2 and mPGES-1 in Mφs treated with Pam3CSK4 (1 or 10 μg/ml) or FSL1 (0.1 or 1 μg/ml) at 24 h after treatment (n=3). Bottom panels: quantization of COX2 protein and mPGES-1 protein. Intensity of the COX2 protein (left panel) and mPGES-1 protein (right panel) was normalized to that of GAPDH and presented as fold change relative to Mφs treated with Pam3CSK4 (10 μg/ml) or FSL-1 (1 μg/ml). Values are expressed as means ± sem of 3 independent experiments. C) Left panel: Western blot of COX2 and mPGES-1 in Mφs treated with the p38 MAPK inhibitor SB202190 (10 μM) or the EP4 antagonist AH23848 (10 μM) and the TLR2 agonists Pam3CSK4 (10 μg/ml) and FSL-1 (1 μg/ml) at 24 h after treatment (n=3). Right panels: quantization of COX2 and mPGES-1 protein expression from Western blot analysis on left side. The intensity of the COX2 protein (left panel) and mPGES-1 protein (right panel) was normalized to that of GAPDH and presented as fold change relative to TLR2 agonists treated Mφs. Values are means ± sem of 3 independent experiments. D) Left panel: Western blot of p38 MAPK phosphorylation at 30 min in H37Ra (MOI 10:1)-infected Mφs treated with an anti-TLR2 antibody (30 μg/ml), which neutralizes TLR2 activity (n=3). Right panel: ratios of P-p38 MAPK to p38 MAPK, shown as fold change relative to Mφs infected with H37Ra only. Values are means ± sem of 3 independent experiments.
