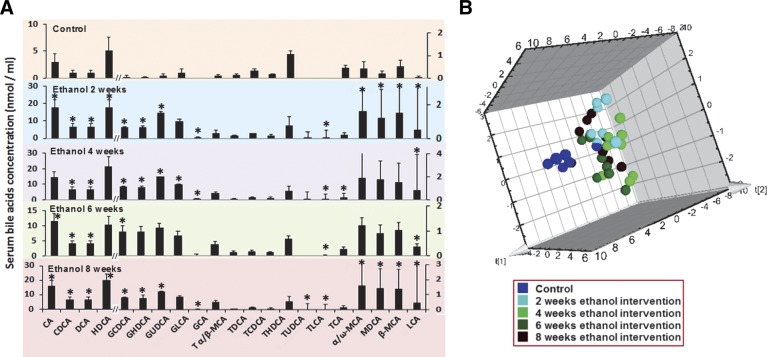
Figure 5.
Time course of the altered serum bile acid profile in response to ethanol consumption. Concentrations of individual bile acids in serum from rats in the control group and the ethanol intervention group at 2, 4, 6, and 8 wk postdose (A) and 3D principal component analysis (PCA) scores plot of serum bile acid profiles at predose and at 2, 4, 6, and 8 wk postdose of the ethanol intervention (B). *P < 0.05 vs. control group.

