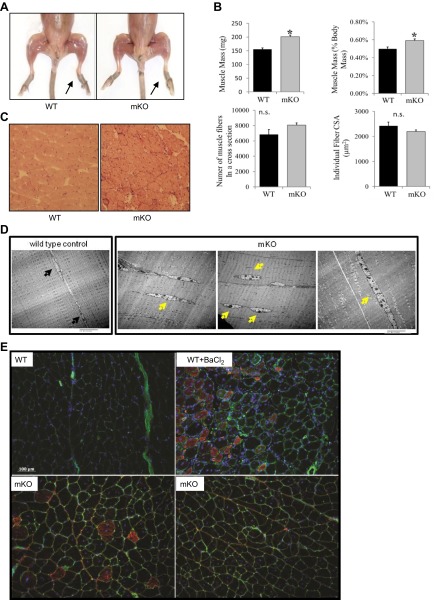
Figure 2.
Muscle morphology in mKO mice. A) Hind-limb muscles from mKO and WT mice (10 mo old). B) Muscle mass expressed in milligrams (top left panel) and as a percentage of body mass (top right panel); number of muscle fibers in a CSA (bottom left panel), and average fiber CSAs for GTN muscles from control mice (solid bars) and mKO mice (shaded bars) at 6–8 mo of age (n=5). *P < 0.05 vs. WT control. C) Details of muscle fiber morphology in representative histological sections stained with hematoxylin and eosin. D) Electron micrographs of longitudinal sections of GTN muscles. E) Immunofluorescent images stained for embryonic myosin heavy chain (red); WGA lectin to visualize extracellular matrix (green), and DAPI to visualize nuclei (blue) in GTN muscles from WT control mice (top left panel), WT mice treated with BaCl2 for 7 d (top right panel), and mKO mice (bottom panels). Black arrows indicate the normal peripheral localization of myonuclei; yellow arrows mark the centrally located nuclei that are frequently seen in mKO muscles.

