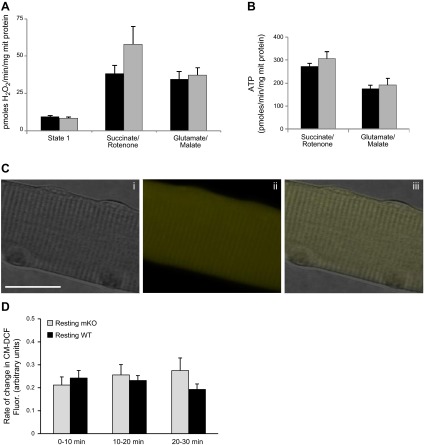
Figure 4.
ROS generation in isolated mitochondria and muscle fibers from mKO mice. A, B) H2O2 (A) and ATP production (B) from isolated skeletal muscle mitochondria (n=5/genotype). C) Confocal images of a single isolated fiber from the FDB muscle after 16 h in culture under bright field (i), fluorescent image following loading with CM-DCFH DA (ii), and merged image of i and ii (iii); original view, ×60. Scale bar = 30 μm). B) Rate of change in DCF fluorescence from resting FDB fibers of WT and mKO mice over the 30-min time course (n=4/genotype). Solid bars, WT mice; shaded bars, mKO mice.

