Figure 3.

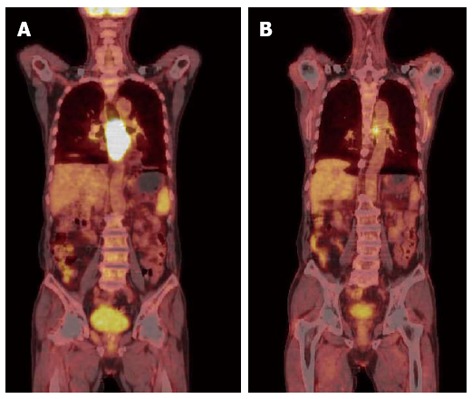
Positron emission tomography/computed tomography. A: Positron emission tomography/computed tomography (PET-CT) showed intense segmental fluorodeoxyglucose uptake (SUV max 17.3) at mid esophagus; B: PET-CT performed at 3 mo ago.

Positron emission tomography/computed tomography. A: Positron emission tomography/computed tomography (PET-CT) showed intense segmental fluorodeoxyglucose uptake (SUV max 17.3) at mid esophagus; B: PET-CT performed at 3 mo ago.