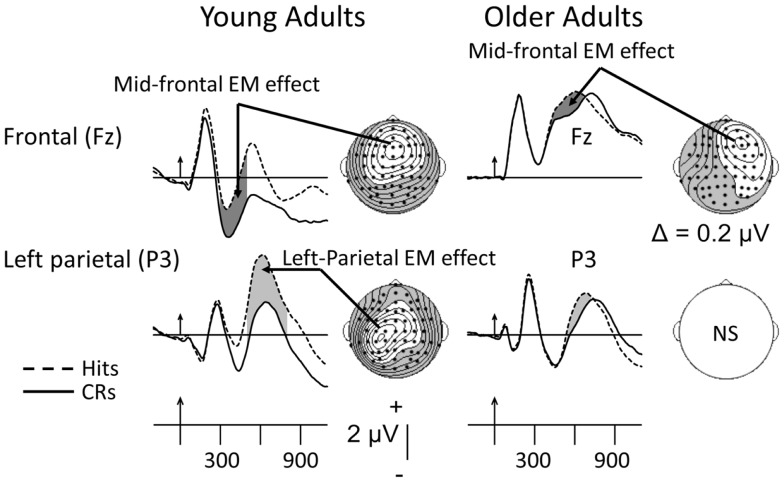
Figure 2.
Grand-mean ERPs averaged across 16 young and 16 older adults to correctly recognized old items (Hits, dashed lines) and correctly rejected new items (CRs, solid lines). Arrows mark stimulus onset with vertical-hash, timing marks every 300 ms. Dark-gray shading in the waveforms indicates the mid-frontal effect; light-gray shading reflects the left-parietal effect. NS, not significant. The maps here and in subsequent figures were computed by calculating contours using the spherical spline algorithm (Perrin et al., 1989) and data from all 62 electrodes (dots). In the topographic maps, unshaded regions reflect positivity; shaded regions reflect negativity. The data have been adapted from Nessler et al. (2007). The mid-frontal and left-parietal maps for the young were computed, respectively, between 300–500 and 500–800 ms. Due to latency prolongation in the older adults, the mid-frontal EM effect was computed between 400 and 600 ms.

