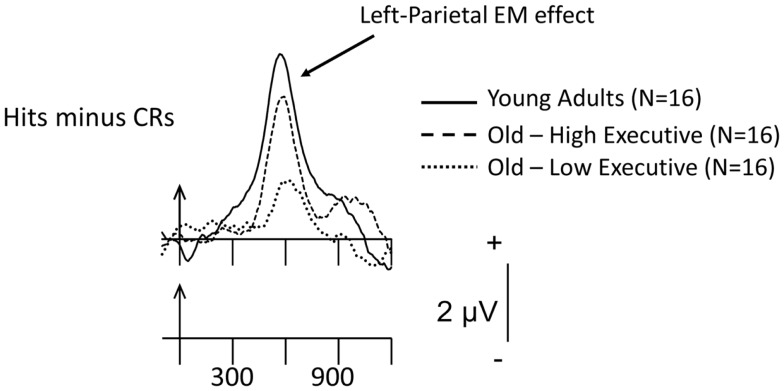
Figure 4.
Grand-mean Hits minus CR difference ERPs for items presented three times during study, averaged across the 16 young adults, 16 old-high executive function (EF), and 16 old-low EF subgroups at the left-parietal scalp site, P3. Arrows mark stimulus onset, with time markers every 300 ms. The waveforms for the three groups have been superimposed. These preliminary data were recorded during the final recognition-memory test phase, which took place 1 h following the initial test series.

