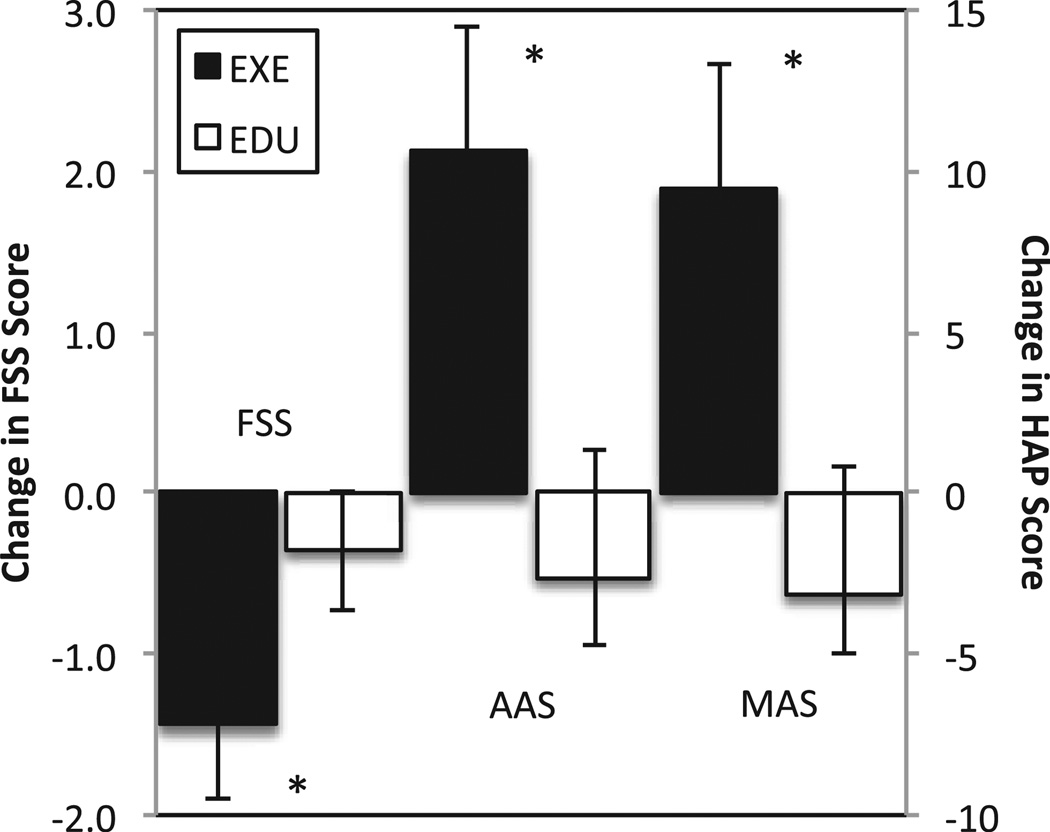
Figure 2.
Change in fatigue severity scale (FSS) and human activity profile (HAP) scores in response to 10-weeks of aerobic exercise training plus education (EXE) or education alone (EDU). *p < 0.05 for difference in change score between EXE group versus EDU group. AAS is the adjusted activity score on the HAP and MAS is the maximal activity score on the HAP.

