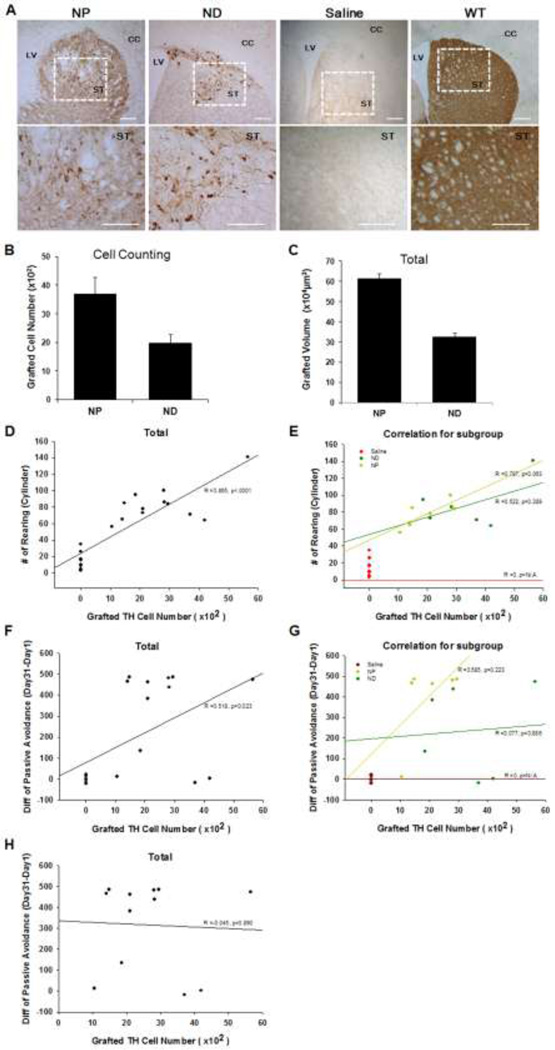
Figure 5.
(A) Transplantation of NP and ND stage cells into the striatum of ak mice resulted in the presence of large numbers of TH+ neurons in the grafts, while no TH+ cells were detected in the sham-operated group. The enlarged brain sections indicated by the boxes show the presence of TH + cell bodies in the host brain. Size bar: 100 µm, Each scale bar is adjusted accordingly. (B&C) Total numbers of TH + neurons and graft volume in the brain of NP-transplanted (n = 6 for each group) (B) and ND-transplanted ak mice (C). At 9 weeks post transplantation, total TH+ cells were counted. In the EB-transplanted group, quantification of TH+ cells was not feasible due to malformation of brain structure. There were statistically significant differences in the numbers of surviving TH+ neurons in the striatum of ak mice transplanted with NP and ND cells. Graft analysis revealed a larger volume in NP transplanted mice than in the ND transplanted group. (D&E) Correlation between graft-induced functional improvement and TH+ cells: Each dot indicates a mouse. There was a strong positive correlation between two variables (Pearson coefficient, r2 = 0.748, p<0.0001). The NP group exhibited a strong positive correlation between the two variables (Pearson coefficient, r2 = 0.619, p < 0.05, black color), but not in the ND group (Pearson correlation coefficient, r2 = 0.273, p > 0.28 for the ND group, N/A for the sham and EB group). (F) There was a positive correlation between two variables (Pearson coefficient, r2 = 0.268, p<0.02). (G & H) However, the positive correlation disappeared when individual groups were analyzed and sham-operated groups were removed.
NA indicates data were not applicable to compare among treatment groups
CC: corpus callosum, LV; lateral ventricle, ST; striatum

