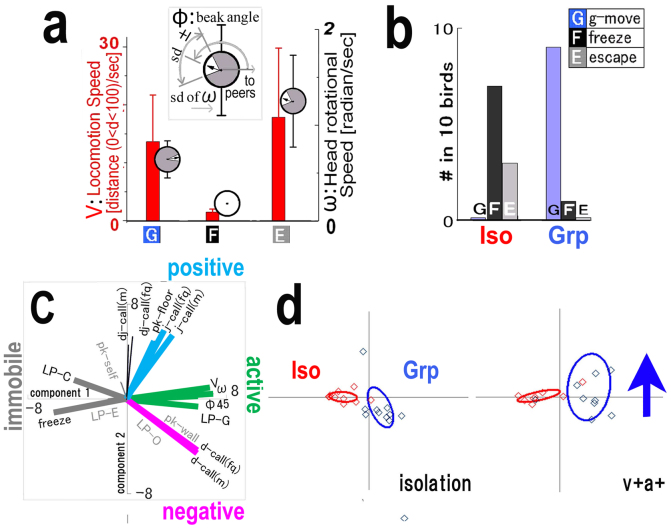
Figure 2. Quantitative comparison of social behaviour in Iso and Grp chicks.
(a) Definitions of the behaviour markers: g-move (G), freeze (F), and escape (E). These markers were defined by three parameters—locomotion speed (V, red), head rotation speed (omega, grey), and beak direction (phi, bar angle in grey circle)—based on data pertaining to 79 birds. (b) Social behaviour of isolated (Iso, n = 10) and grouped (Grp, n = 10) chicks were compared with three markers (G, F, and E). (c) The principal component analysis (PCA) of the social test in two contexts. The factor loading vectors with four colour codes representing emotional valence (active; green, immobile; grey, positive; blue, and negative; red). (d) The first and second PCA scores of each animal group are plotted together with the approximated variance ellipse for each rearing condition (Grp or Iso). The blue arrow shows the direction of the Grp ellipse shift from the isolation to v + a+ context.

